
Valuations Dive Again Due To China/Commodities Worries
ValuEngine tracks more than 7000 US equities, ADRs, and foreign stock which trade on US exchanges as well as @1000 Canadian equities. When EPS estimates are available for a given equity, our model calculates a level of mispricing or valuation percentage for that equity based on earnings estimates and what the stock should be worth if the market were totally rational and efficient--an academic exercise to be sure, but one which allows for useful comparisons between equities, sectors, and industries. Using our Valuation Model, we can currently assign a VE valuation calculation to more than 2800 stocks in our US Universe.
We combine all of the equities with a valuation calculation to track market valuation figures and use them as a metric for making calls about the overall state of the market. Two factors can lower these figures-- a market pullback, or a significant rise in EPS estimates. Vice-versa, a significant rally or reduction in EPS can raise the figure. Whenever we see overvaluation levels in excess of @ 65% for the overall universe and/or 27% for the overvalued by 20% or more categories, we issue a valuation warning.
We now calculate that less than a third of the stocks we can assign a valuation are overvalued--31.7%--and just 9.89% of those stocks are overvalued by 20% or more. These figures continue to fluctuate, and of late they are stuck below the 40% we consider to be "normal."
We did our last valuation study on August 18th, and since then we have seen a market slide and lots of volatility with the S&P dropping from @2100 down to the 1800-2000 range. This pull back was initially driven by the Chinese sell off and currency devaluation. Since then, we have found shock waves from that drop and related events impacting equity pricing across the globe.
We saw one day with levels this low near the end of August, but prior to that, you would have to go back to mid-November 2012, to find overvaluation levels below 30%. At that time, the S&P 500 was at 1353. So, from our perspective, with the market now at 1883 or so as of this writing, stocks are "cheap" and oversold. But the market is always right, so what we think does not trump that trend.
In addition, we now have the recent FOMC decision to leave short-term rates unchanged to consider. Fed officials noted that turmoil in China and other emerging markets may have a negative spillover effect for the underlying US economy. Indeed, as we have noted lately, news from companies such as Caterpillar indicates a global slow down. Anything dealing with global commodities and construction can play a role.
And, to throw in random events, seemingly unrelated, you had the bone-headed greed of a pharma CEO and the shady practices of an auto giant causing turmoil in bio-tech and the auto industry and more selling.
But, as always, we note a stronger US economy, with the labor situation improving by the day, some upward wage pressures, continued recovery for housing, a strong rental market, decent auto sales--but probably NOT for VW moving forward!-- etc. US equities remain standing as the last bastion of decent yield for scared investors the world over.
What we fear more now is some sort of additional austerity measures from misguided right-wing politicians in Washington DC. Or, a Fed that raises rates not in relation to its twin-mandate--control inflation and ensure full employment--but as some sort of sop to some bankers, who want a rate increase for their own needs, or to "send a message" that rates can be raised merely because the economy is strong enough to absorb an increase.
This is not what the Fed is supposed to be about. And hitting the brakes right now, in the face of the Chinese issues and other emerging market concerns vis a vis commodities and such, makes no sense. We believe the market slide will be temporary, driven by events over seas, not any sort of underlying weakness in the US economy. But, we live in an ever-more interdependent world. One cannot ignore events overseas. But, one also should realize that our models see a buying opportunity here. That does not mean things cannot decline further, just that from their perspective equities are far cheaper than they were over much of the past three years.
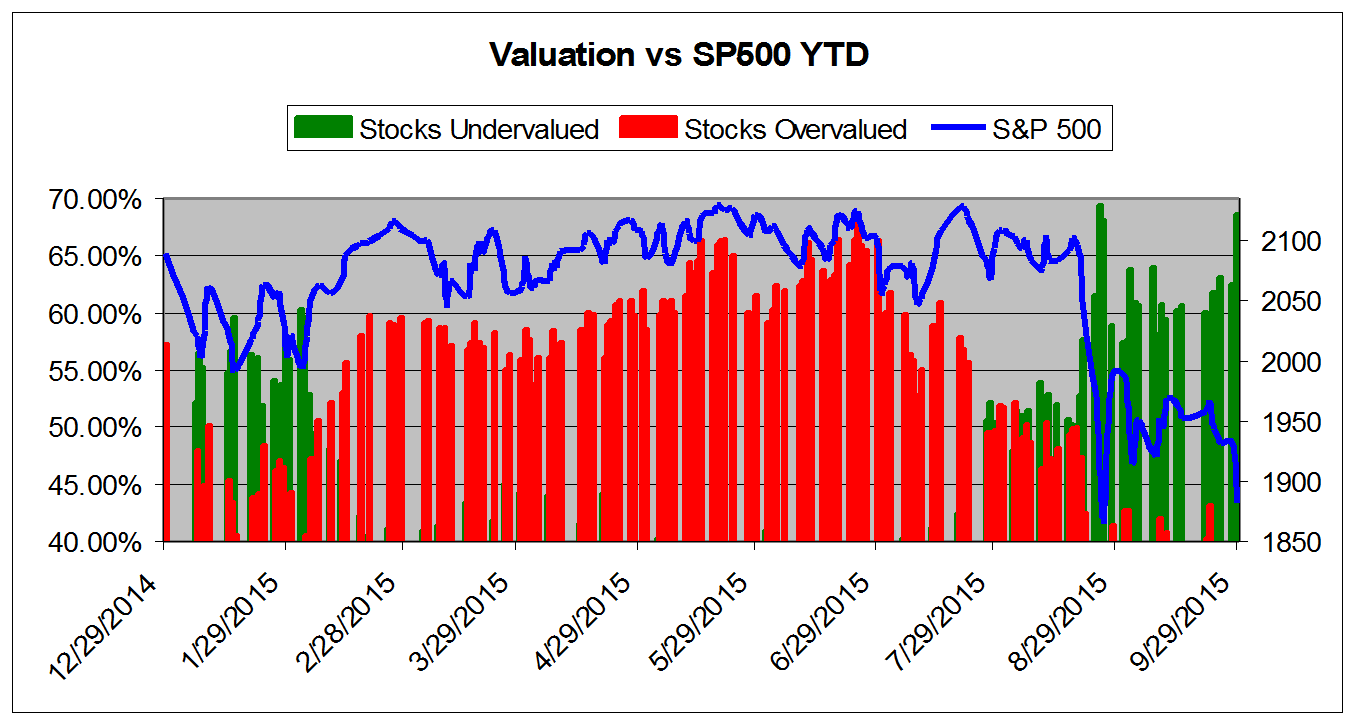
The chart below tracks the valuation metrics from January 2015. It shows levels in excess of 40%.
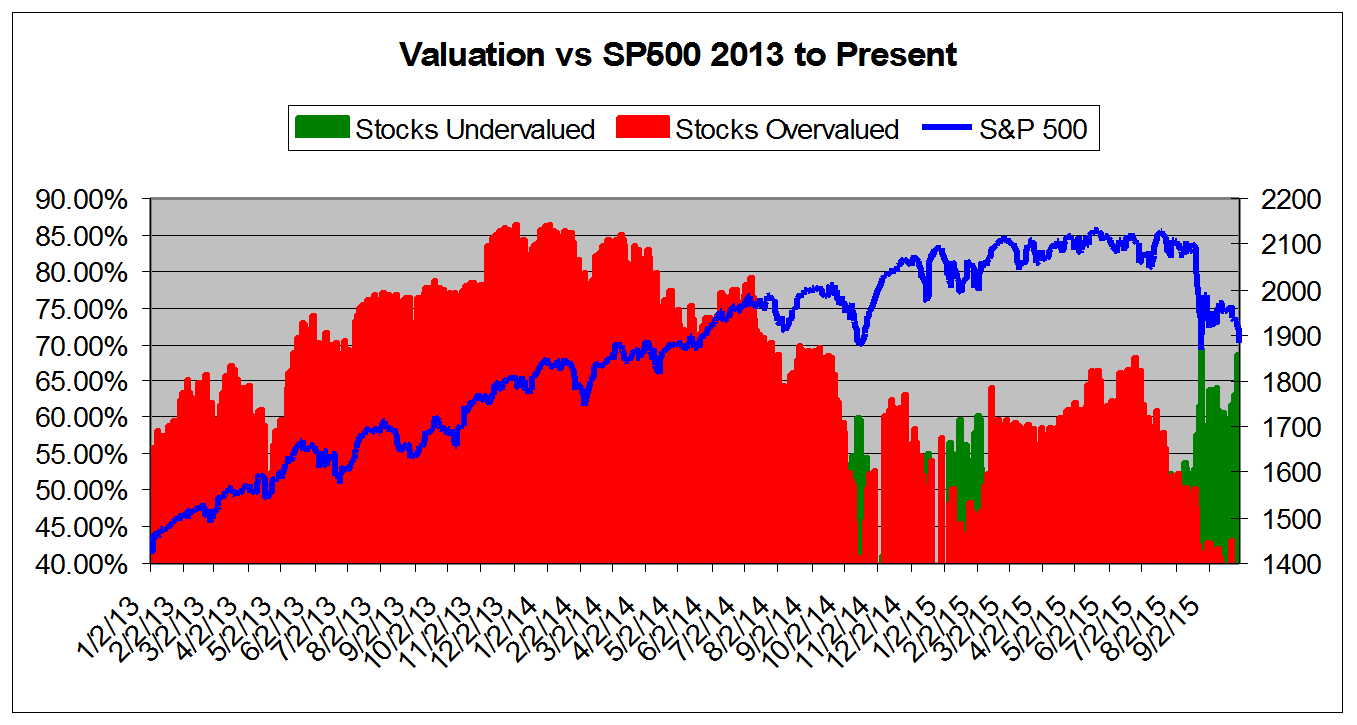
This chart shows overall universe over valuation in excess of 40% vs the S&P 500 from January 2013
This chart shows overall universe under and over valuation in excess of 40% vs the S&P 500 from March 2007*
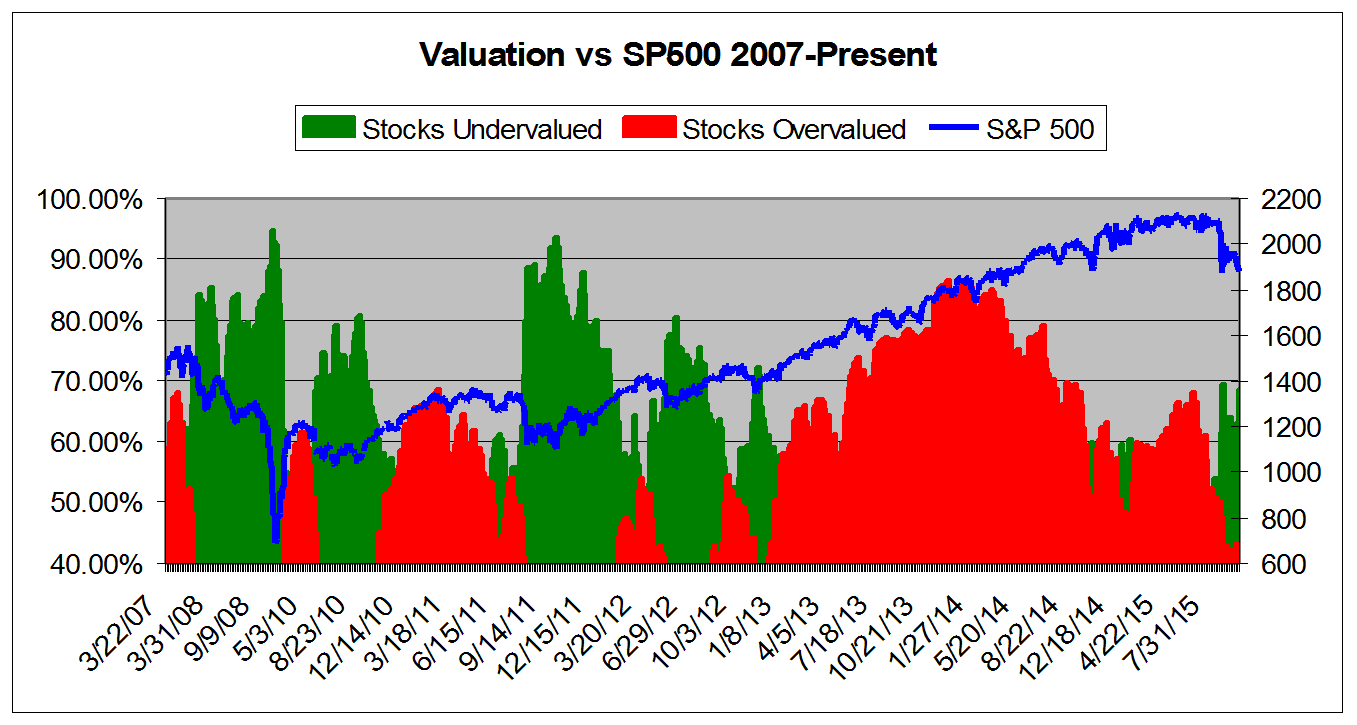
*NOTE: Time Scale Compressed Prior to 2011.
ValuEngine Market Overview
|
Summary of VE Stock Universe |
|
|
Stocks Undervalued |
68.5% |
|
Stocks Overvalued |
31.5% |
|
Stocks Undervalued by 20% |
32.24% |
|
Stocks Overvalued by 20% |
9.89% |
ValuEngine Sector Overview
|
Sector |
Change |
MTD |
YTD |
Valuation |
Last 12-MReturn |
P/E Ratio |
|
-1.05% |
-3.44% |
-6.55% |
2.03% overvalued |
-11.58% |
16.62 |
|
|
-1.57% |
-2.44% |
-6.26% |
1.63% undervalued |
-4.58% |
22.79 |
|
|
-1.89% |
-2.54% |
-4.12% |
4.04% undervalued |
-4.97% |
16.40 |
|
|
-5.27% |
-8.36% |
-0.20% |
4.40% undervalued |
2.73% |
29.79 |
|
|
-2.50% |
-4.61% |
-5.37% |
4.70% undervalued |
-3.62% |
22.23 |
|
|
-2.00% |
-4.20% |
-10.50% |
5.45% undervalued |
-9.05% |
20.77 |
|
|
-2.18% |
-4.22% |
-2.44% |
5.64% undervalued |
-5.90% |
25.10 |
|
|
-2.42% |
-4.84% |
-10.39% |
6.60% undervalued |
-5.42% |
21.57 |
|
|
-1.58% |
-5.08% |
-12.31% |
7.58% undervalued |
-9.21% |
18.96 |
|
|
-1.94% |
-4.58% |
-7.62% |
7.79% undervalued |
-7.86% |
26.86 |
|
|
-2.37% |
-6.19% |
-6.84% |
11.03% undervalued |
-5.46% |
19.94 |
|
|
-1.90% |
-5.85% |
-13.78% |
15.78% undervalued |
-16.59% |
17.33 |
|
|
-2.29% |
-7.25% |
-13.65% |
16.08% undervalued |
-13.08% |
13.80 |
|
|
-2.43% |
-6.99% |
-16.63% |
16.91% undervalued |
-17.04% |
15.11 |
|
|
-4.02% |
-14.86% |
-26.57% |
20.95% undervalued |
-51.15% |
22.75 |
|
|
-3.10% |
-9.70% |
-21.79% |
22.85% undervalued |
-32.05% |
19.29 |
VALUATION WATCH: Overvalued stocks now make up 31.5% of our stocks assigned a valuation and 9.89% of those equities are calculated to be overvalued by 20% or more. One sector is calculated to be overvalued.
Disclosure: None.
ValuEngine.com is an independent research provider, producing buy/hold/sell recommendations, target price, and valuations on over 7,000 US and Canadian equities every trading ...
more

