
USD/JPY, USD/CHF Bounce From Support Ahead Of The Fed
US DOLLAR DROPS AHEAD OF DECEMBER FOMC
Tomorrow marks the start of this week’s high-impact events on the economic calendar, with UK inflation kicking off the day at 4:30 AM ET, and this is followed by Canadian inflation numbers at 8:30 AM. Later in the afternoon brings the final FOMC rate decision of the year, and this carries the wide-expectation of another 25 basis point rate hike out of the bank for the fourth such move in 2018. This rate hike has been long-expected, and while delaying tomorrow’s move might appear to be a positive for equity markets in the short-term, this may actually create more stress than it quells; so it looks as though the Fed will stick to the plan and hike rates.
The big question around the Fed for tomorrow is how aggressive the bank might be looking to move rates in 2019 and thereafter. At this point, markets expect one rate hike next year. The Fed, per the most recent dot plot matrix, are looking at two to three. Will the Fed back down after the Q4 volatility in equities? Or will the bank continue to look to normalize policy given the continued strength in employment and with inflation remaining above 2%?
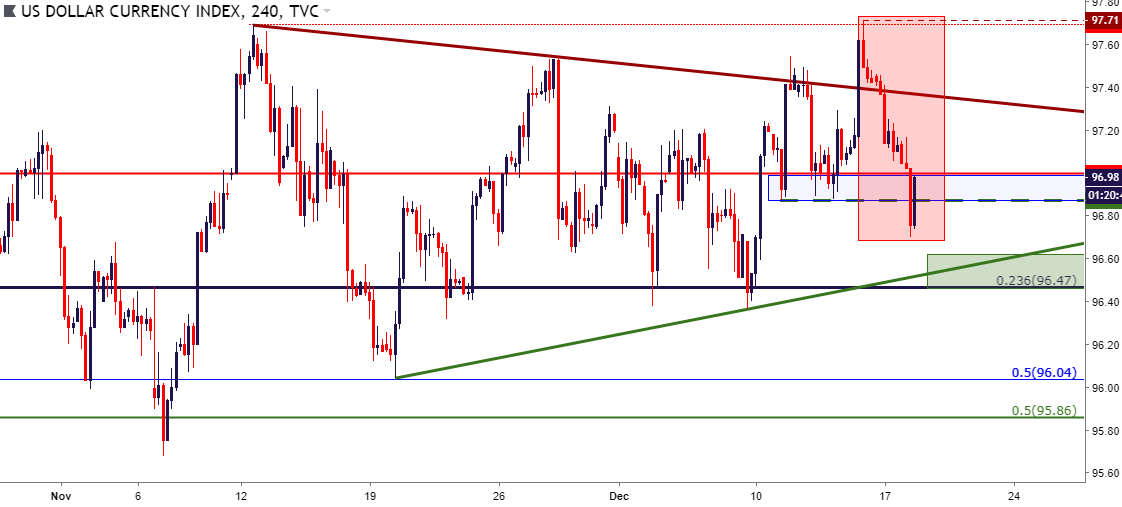
Ahead of tomorrow’s rate decision the US Dollar is continuing to fall after last week’s test of fresh yearly highs. The Dollar nudged slightly above the prior high watermark last Friday morning. Since then, the currency has been in retreat, falling below last week’s support zone and making a fast move towards the 96.47 level that’s already been tested twice in the month of December.
US DOLLAR FOUR-HOUR PRICE CHART
(Click on image to enlarge)
FRESH SIX-MONTH LOWS IN STOCKS MAKE FOR A DIFFICULT ENVIRONMENT FOR TIGHTER POLICY
While the Fed’s dual mandate appears ready to absorb another rate hike, the current global backdrop would be an awkward outlay for longer-term hawkishness. It was just a couple of days after the Q4 open that US equities began to swan dive, and this took place on the heels of a speech from Jerome Powell in which the head of the US Central Bank implied that a number of rate hikes remained on the table as the Fed was ‘a long way’ from the neutral rate. In short order, equities started to erase prior Q3 gains and by the time late November rolled around, Powell’s verbiage had shifted to a softer tone. In late November, Chair Powell said that the Fed was ‘just under’ the neutral rate, and this provided a spate of strength that lasted into November. But, even that couldn’t hold as resistance soon showed up around the 23.6% retracement of the 2018 move in stocks, and sellers re-gained control to push prices down to fresh six month lows, which showed up yesterday.
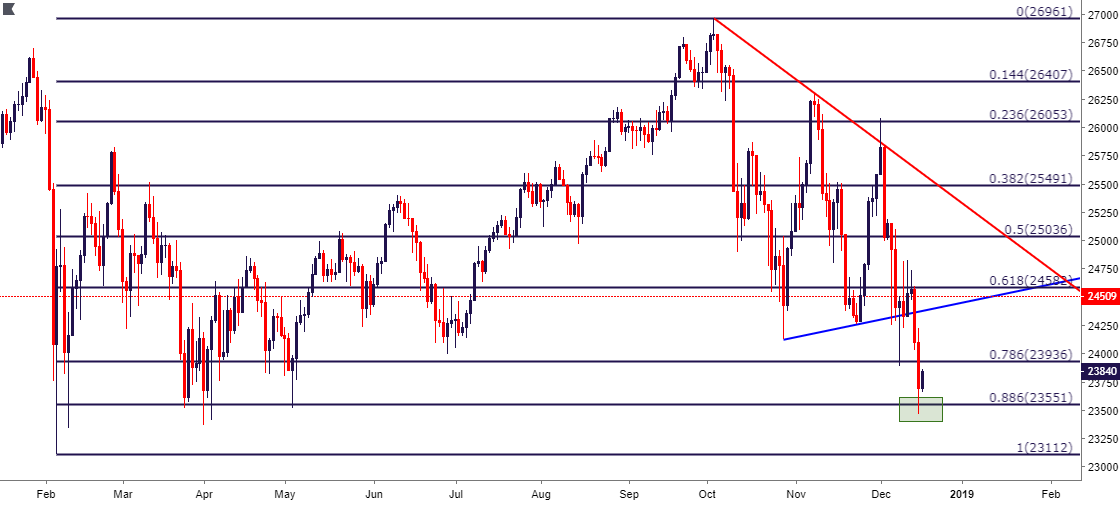
At this point, the Dow Jones Industrial Average is bouncing from support after a test of the 88.6% Fibonacci retracement of the 2018 move, taking the February low up to the October high. The Dow is in negative territory for the year as the 2018 open resides around 24,500 and prices are currently holding below 24k.
DOW JONES DAILY PRICE CHART: BOUNCE AT THE 88.6% FIBONACCI RETRACEMENT
(Click on image to enlarge)
S&P 500 BOUNCES AFTER RE-TEST OF 2018 LOWS
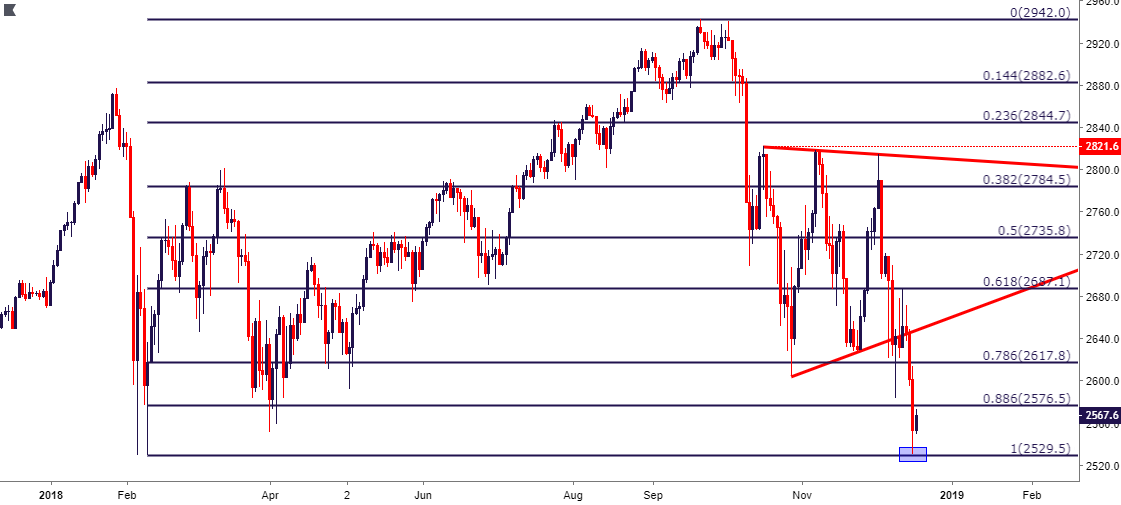
As followed in the equities forecasts over the past few months, the S&P 500 has exhibited a bit more pressure to the downside as themes of weakness have been priced-in to stocks. While the Dow is bouncing from this year’s 88.6% Fibonacci retracement, the S&P 500 fell all the way down to the February low yesterday, and that 88.6% marker may come-in as short-term resistance. This keeps the blue-chip Dow Jones index as a touch more attractive for bullish equity plays ahead of tomorrow’s FOMC rate decision.
S&P 500 DAILY PRICE CHART: GRASPING FOR SUPPORT AT THE FEBRUARY 2018 LOW
(Click on image to enlarge)
EUR/USD BOUNCES UP TO 1.1400 AFTER LAST WEEK’S BEARISH TEST
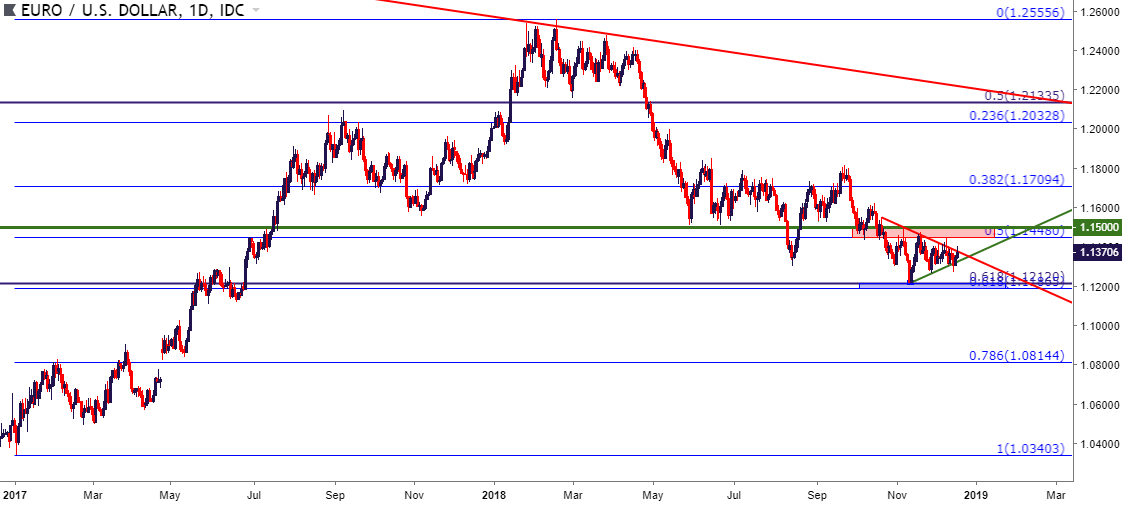
Last week saw the European Central Bank announce the end of bond buying from their QE program, and the Euro responded with a downside break of the symmetrical triangle that had been brewing for the past month. As I had warned in the webinar following that rate decision, chasing the pair could be a difficult prospect, and the longer-term support lurking below could be a better meter for establishing short-side positioning in the pair. That support runs from Fibonacci levels at 1.1187-1.1212, and sellers have thus far appeared uninterested in testing that zone. Prices have since moved higher with this morning marking another test at the 1.1400 psychological level. This could keep the door open for a test of the resistance zone that’s been in play for much of the quarter that runs from 1.1448-1.1500.
EUR/USD DAILY PRICE CHART
(Click on image to enlarge)
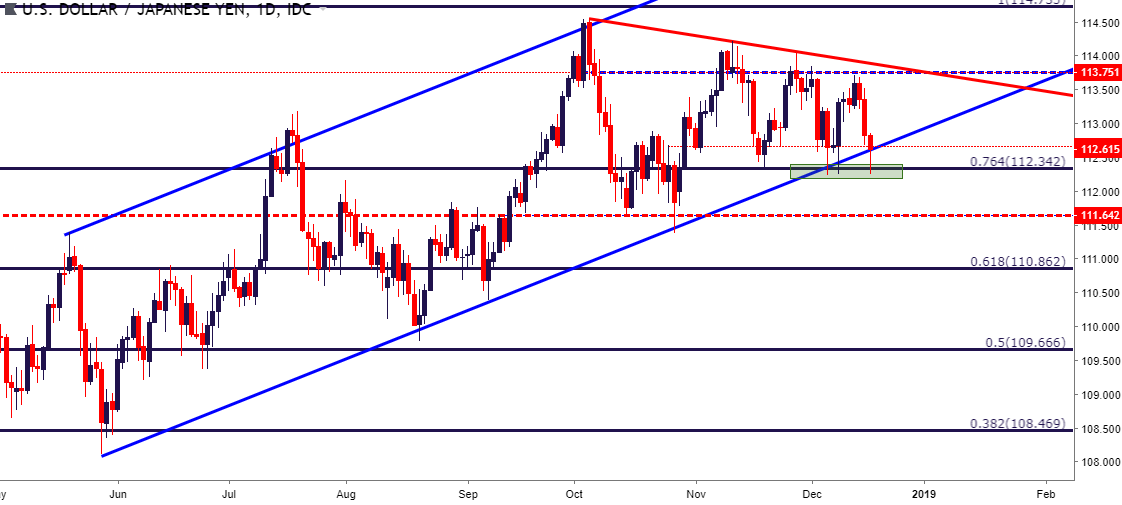
USD/JPY DROPS DOWN TO KEY FIBONACCI SUPPORT
On the short side of the US Dollar, I looked at USD/JPY coming into this week, looking for prices to soften from resistance for a re-test of a key Fibonacci level at 112.34, which is the 76.4% retracement of the November 2017 to March 2018 major move. That’s already taken place as USD/JPY has turned-lower, and this has produced a downside test of the bullish channel that’s been in play since June of this year. Will sellers be able to push down to fresh seven-week lows around tomorrow’s FOMC rate decision?
Also of note is a Bank of Japan rate decision on Wednesday night following the Fed, and Thursday evening brings Japanese inflation for the month of November.
USD/JPY DAILY PRICE CHART: BOUNCING AFTER TESTS OF SEVEN-WEEK LOWS
(Click on image to enlarge)
USD/CHF BACK TO .9902 AFTER LOWER-HIGH RESISTANCE POSTS BELOW PARITY
Also on the side of USD-weakness, I was looking at USD/CHF coming into this week, largely under the premise of resistance holding around the parity level on the pair following the earlier-month grind in that region. Sellers came back on yesterday and prices have pushed lower, bringing the first target into play around the .9902 level, which is the 61.8% Fibonacci retracement of the two-year major move in the pair.
USD/CHF FOUR-HOUR PRICE CHART
(Click on image to enlarge)
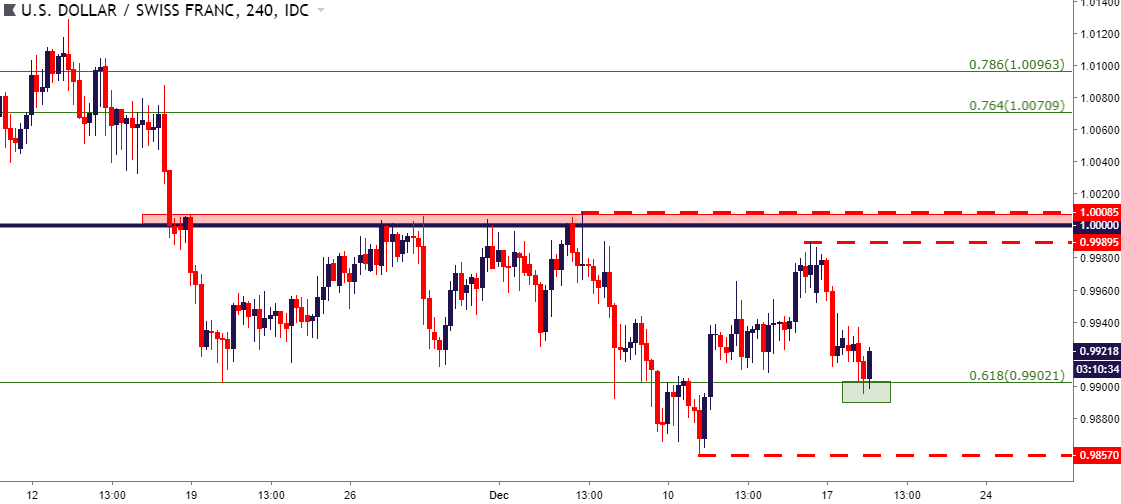
Chart prepared by James Stanley
AUD/USD RE-TESTS KEY SUPPORT ZONE AS POTENTIAL RESISTANCE
On the long side of the US Dollar, a bit of pressure has started to show in AUD/USD following the bullish breakout from last month. This was previously a pair that I had looked at for strategies of USD-weakness, as the month of October saw a respectable build of support above the .7000 big figure, even as US Dollar strength was taking over. As the USD pulled back in the opening days of November, AUD/USD was ready to fly, and prices soon pushed up to fresh three-month highs.
But December has brought a change of tone to the pair, and last week I had looked at the build of a bear flag formation after prices re-tested a key zone of support that runs from .7185-.7205. That bear flag began to unfold on Friday as the US Dollar tested those fresh yearly highs, and this made the prospect of a return of bearish price action look a bit more attractive.
Prices have now pulled back to test resistance in that prior zone of support, and this can keep the door open for short-side strategies for traders looking to take on long-USD exposure.
AUD/USD FOUR-HOUR PRICE CHART
(Click on image to enlarge)
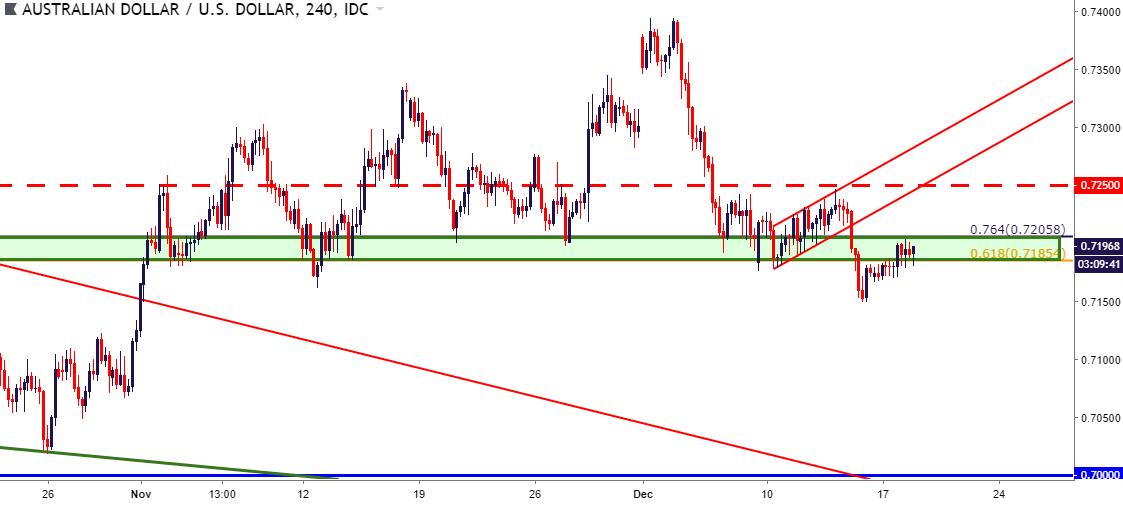
Chart prepared by James Stanley
Disclosure: Do you want to see how retail traders are currently trading the US Dollar? Check out our IG Client Sentiment ...
more

