
USD/JPY Triangle Pattern Waiting For Decisive Breakout
4 hour
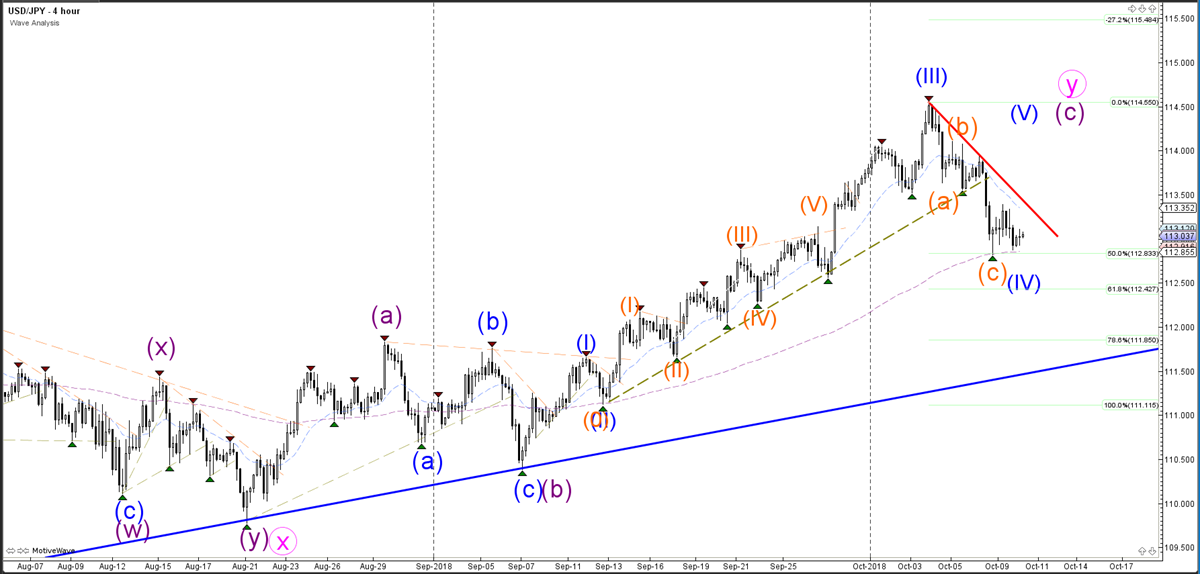
Source: Admiral Markets MT5 with MT5SE Add-on USD/JPY motive wave – Accessed 10 October 2018 at 5:30 AM GMT
The USD/JPY currency pair is testing a key support level and decision zone. The 50% Fibonacci retracement level at 112.83 is a critical bounce or break spot for the wave 4 pattern (blue). A bearish break could see the price test another key support zone at 112.50, but a break below that could indicate a downtrend. A bullish breakout above the resistance trend line (red) could indicate an uptrend continuation.
1 hour
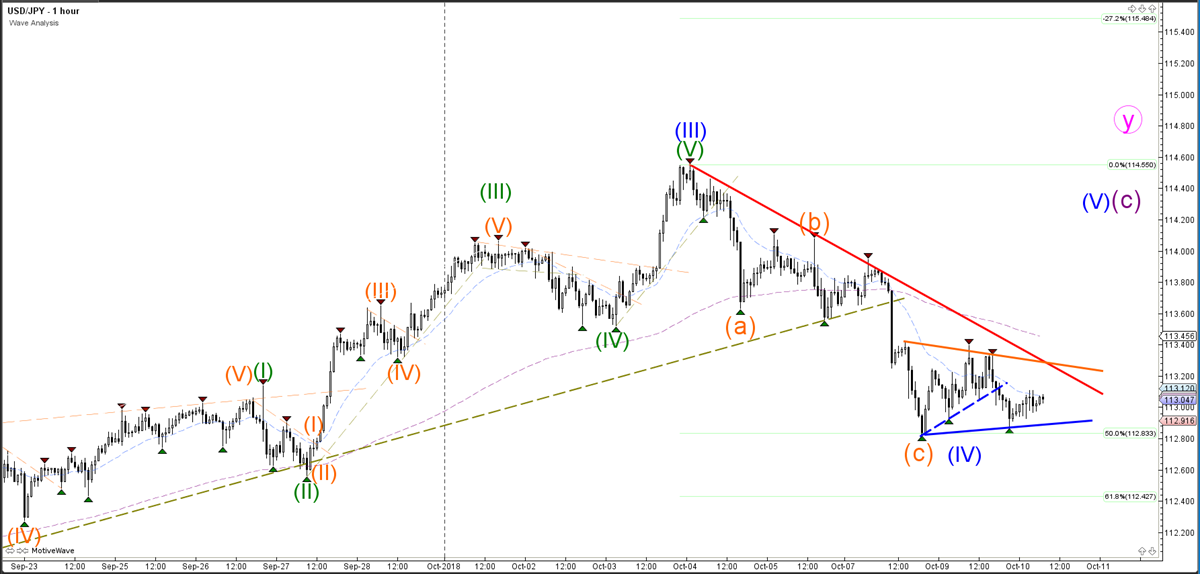
Source: Admiral Markets MT5 with MT5SE Add-on USD/JPY motive wave – Accessed 10 October 2018 at 5:30 AM GMT
The USD/JPY is building a triangle pattern, and the breakout direction will depend on candlestick patternsthat push through support (blue) or resistance (red), and whether the price has a better chance of moving higher or lower.
Weekly
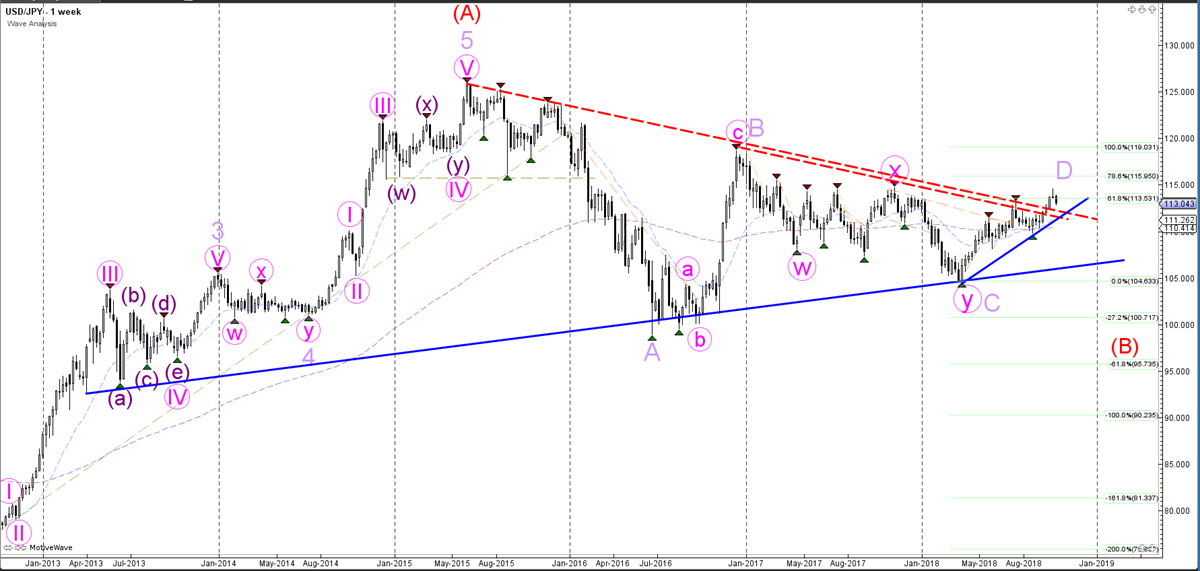
Source: Admiral Markets MT5 with MT5SE Add-on USD/JPY motive wave – Accessed 10 October 2018 at 5:30 AM GMT
The USD/JPY currency pair broke above the resistance trend lines (dotted red), but the breakout might be limited due to the potential triangle chart pattern that is taking place via the ABCD (purple) within wave B (red). The price could bounce at the Fibonacci levels if the price is indeed building a triangle pattern.
Disclaimer: The opinions in this article are for informational and educational purposes only and should not be construed as a recommendation to buy or sell the stocks mentioned or to solicit ...
more

