USD/JPY Strength Dwindles, RSI Pulls Back Ahead Of BoJ Rate Decision
(Click on image to enlarge)
USD/JPY STRENGTH DWINDLES AHEAD OF BANK OF JAPAN (BOJ) RATE DECISION. RELATIVE STRENGTH INDEX (RSI) PULLS BACK FROM OVERBOUGHT TERRITORY.
![]()
The recent advance in USD/JPY appears to be losing steam as the pair fails to extend the higher highs from earlier this week, and fresh comments from the Bank of Japan (BoJ) may alter the near-term outlook for the dollar-yen exchange rate should the central bank show a greater willingness to move away from its easing-cycle.
Even though the BoJ is widely expected to retain the Quantitative/Qualitative Easing (QQE) Program with Yield-Curve Control in April, the central bank may start to change its tune as officials hold internal discussions on a potential exit strategy. In turn, Governor Haruhiko Kuroda and Co. may prepare Japanese households and businesses for a less accommodative stance, and a material change in the policy statement may fuel a larger pullback in USD/JPY as the central bank still anticipates inflation to hit the 2% target ‘around fiscal 2019.’
In contrast, more of the same from the BoJ may keep USD/JPY afloat as the Federal Open Market Committee (FOMC) appears to be on course to further normalize monetary policy over the coming months, and the dollar-yen may stay bid ahead of the Fed interest rate decision on May 2 as Chairman Jerome Powelland Co. as ‘expects that economic conditions will evolve in a manner that will warrant further gradual increases in the federal funds rate.’
USD/JPY DAILY CHART
(Click on image to enlarge)
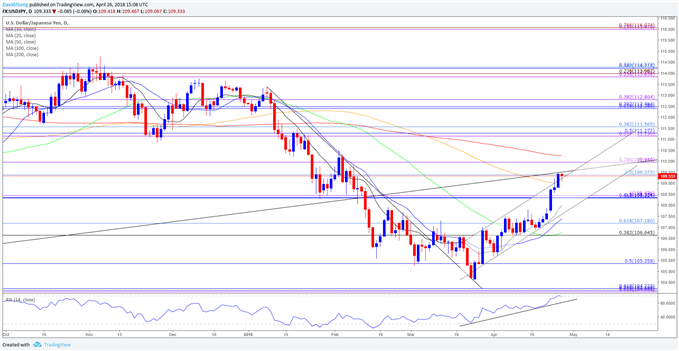
- The near-term advance in USD/JPY appears to be stalling around the 109.40 (50% retracement) to 110.00 (78.6% expansion) area as it struggles to extend the bullish sequence from earlier this week, while the Relative Strength Index (RSI) falls back from overbought territory.
- Keep in mind, topside targets remain on the radar for USD/JPY as both price and the RSI retain the upward trends carried over from the previous month, with a break/close above the stated region raising the risk for a move towards 111.10 (61.8% expansion) to 111.60 (38.2% retracement).
- Need a break/close back below the 108.30 (61.8% retracement) to 108.40 (100% expansion) region to open up the downside targets, with the first area of interest coming in around 106.70 (38.2% expansion) to 107.20 (61.8% retracement).
EUR/USD REMAINS UNDER PRESSURE AS EUROPEAN CENTRAL BANK (ECB) FAILS TO DELIVER EXIT STRATEGY. OUTLOOK MIRED BY BEARISH SEQUENCE.
![]()
EUR/USD remains under pressure as the European Central Bank (ECB) sticks to the current script, with euro-dollar at risk of facing a further decline as the central bank appears to be in no rush to taper the quantitative easing (QE) program.
Recent remarks from the ECB suggests the Governing Council will retain the current policy throughout the first-half of 2018 as ‘measures of underlying inflation remain subdued and have yet to show convincing signs of a sustained upward trend,’ and the wait-and-see approach keeps the near-term outlook for EUR/USD tilted to the downside as President Mario Draghi and Co. refrain from delivering a more detailed exit strategy.
With that said, attention now turns to the U.S. Gross Domestic Product (GDP) report, which is projected to show a slowdown in the growth rate, but a pickup in the core Personal Consumption Expenditure (PCE), the Fed’s preferred gauge for inflation, may fuel the recent weakness in EUR/USD as it encourages the FOMC to deliver four rate-hikes in 2018.
EUR/USD DAILY CHART
(Click on image to enlarge)
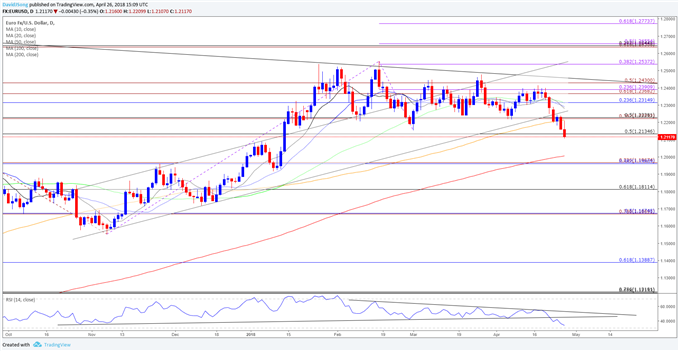
- EUR/USD stands at risk for a further decline as it clears the March-low (1.2155), with a close below 1.2130 (50% retracement) opening up the next area of interest around 1.1960 (38.2% retracement) to 1.1970 (23.% expansion).
- Keeping a close eye on the RSI as it approaches oversold territory, with move below 30 raising the risk for a further decline in the exchange rate as the bearish momentum gathers pace.
- Next downside hurdle comes in around 1.1810 (61.8% retracement) followed by the Fibonacci overlap around 1.1670 (78.6% expansion) to 1.1680 (50% retracement).
(Click on image to enlarge)