
USD/JPY Inverse H&S Takes Shape Above 112.50; FOMC Minutes On Tap
|
Currency |
Last |
High |
Low |
Daily Change (pip) |
Daily Range (pip) |
|
USD/JPY |
113.34 |
113.73 |
112.91 |
34 |
82 |
USD/JPY Daily
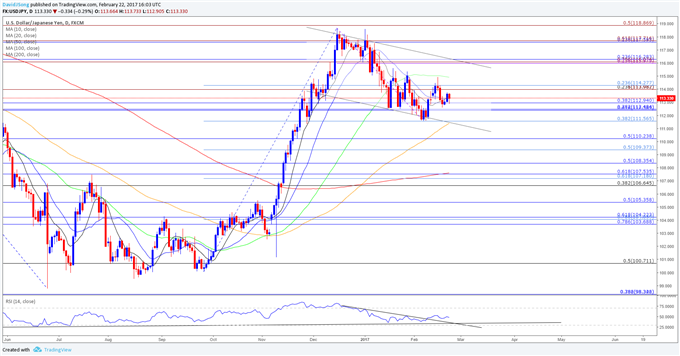
Chart - Created Using Trading View
- The Japanese Yen outperforms its major counterparts, with the decline in USD/JPY largely accompanied by a pullback in the global benchmark equity indices, but the pair may stage a larger recovery over the coming days as it carves an inverse head-and-shoulders formation; failure to push below the Fibonacci overlap around 112.40 (61.8% retracement) to 112.50 (38.2% retracement) keeps the near-term bias tilted to the topside as the dollar-yen appears to be in the process of forming the right-shoulder.
- With market focus turning to the Federal Open Market Committee (FOMC) Minutes, the policy statement may spark a bullish reaction in the greenback as a growing number of central bank officials see scope to raise the benchmark interest rate sooner rather than later, but more of the same rhetoric may drag on the dollar as Fed Fund Futures continue to highlight a greater than 60% probability the Fed will retain the status quo at the next meeting in March.
- The FOMC may continue to warn ‘market-based measures of inflation compensation remain low; most survey-based measures of longer-term inflation expectations are little changed’ especially as Chair Janet Yellen argues ‘inflation moved up over the past year, mainly because of the diminishing effects of the earlier declines in energy prices and import prices,’ and the dollar may face near-term headwinds should the central bank tame expectations for an imminent rate-hike; with that said, risk trends may continue to influence USD/JPY price action over the coming days should the Fed Minutes fail to shift interest rate expectations.
- Will retain a constructive outlook for USD/JPY as long as it holds above the Fibonacci overlap around 112.40 (61.8% retracement) to 112.50 (38.2% retracement), with a break/close above 114.00 (23.6% retracement) to 114.30 (23.6% retracement) opening up the next topside region of interest around 116.00 (78.6% expansion) to 116.30 (23.6% retracement).
|
Currency |
Last |
High |
Low |
Daily Change (pip) |
Daily Range (pip) |
|
USD/CAD |
1.3196 |
1.3210 |
1.3110 |
55 |
100 |
USD/CAD Daily
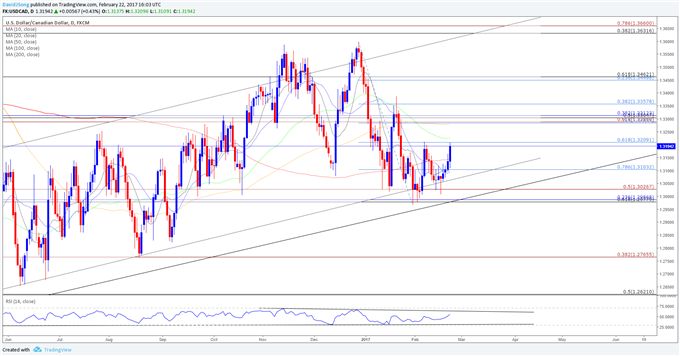
Chart - Created Using Trading View
- USD/CAD extends the advance from earlier this week as Canada Retail Sales disappoints, with the broader outlook tilted to the topside as the pair continues to operate within the upward trending channel carried over from the previous year; however, the lack of momentum to break the monthly high (1.3212) may foster range-bound conditions over the remainder of the week as attention turns to the region’s Consumer Price Index (CPI), which is expected to show the headline reading for inflation advancing to an annualized 1.6% from 1.5% in December.
- A deeper look at the report showed narrowing demand for large-ticket items (autos, furniture, and electronics), with discretionary spending on clothing also contraction 3.7%, and the downturn in household spending may drag on inflation as it pushes Canadian firms to offer discounted prices; in turn, a dismal CPI print may spark additional headwinds for the loonie especially as the Bank of Canada (BoC) warns ‘inflation in Canada has been lower than anticipated since October.’
- With that said, the near-term outlook for USD/CAD remains constructive as the exchange rate continues to push off of the Fibonacci overlap around 1.2980 (61.8% retracement) to 1.2990 (23.6% retracement), but the pair needs to break/close above 1.3210 (61.8% retracement) to stage a run at the next topside target around 1.3290 (50% retracement) to 1.3310 (38.2% retracement).
How did you like this article? Let us know so we can better customize your reading experience.

Comments
Leave a comment to automatically be entered into
our contest to win a free Echo Show.

