
USD/JPY False Breakout Coincides With US S&P 500 Breakdown
Video length: 00:08:54
Risk markets are in bad shape today after the technical damage done, in aggregate, over the past several days. Anytime that you see the US Dollar, Crude Oil, and equity markets down, and Gold and the Japanese Yen up, it's typically a bad sign for risk sentiment in the market. Traders are positioning themselves as if something ominous is looming.
Chart 1: USD/JPY Daily Chart (May 2016 to October 2016)
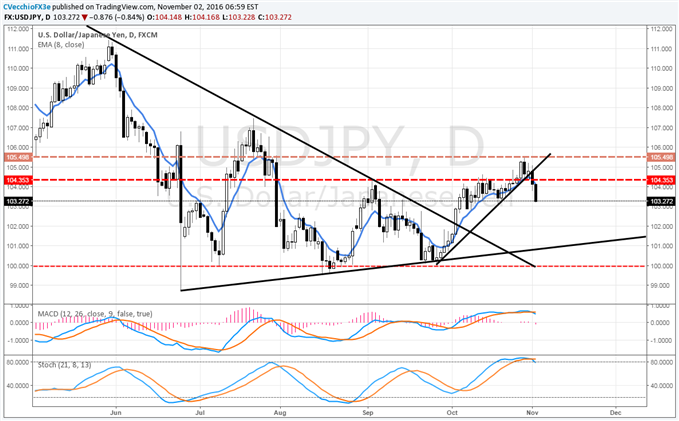
Earlier this week, USD/JPY had a promising start with a potential break through ¥104.35; however, it now appears that a false breakout has instead transpired. In fact, the risk across the spectrum has reversed and sentiment has eroded: putting USD/JPY's reversal in context of the move in the US S&P 500, and it's evident that investors feel there is a threat to the US economy. My colleague Paul Robinson's look at the charts today arrived at a similar conclusion.
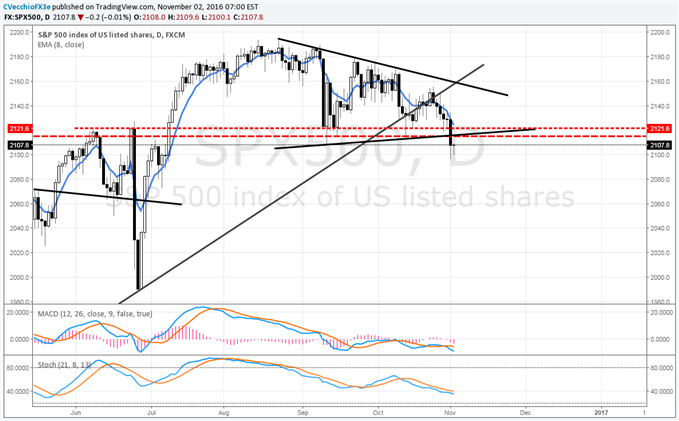
Chart 2: US S&P 500 Daily Chart (May 2016 to October 2016)
Looking at the economic calendar, it doesn't appear that price action in global markets today could be due to the upcoming Federal Reserve meeting. After all, without a new summary of economic projections (SEP), the FOMC is too scared to lose credibility to move on rates without justification in hand. Concurrently, and more simply, the FOMC is not going to want to more volatility with just six days to the US Presidential elections.
Regardless of the politics, for now, expect the FOMC to look through the elections and prepare the markets for a December 14 rate hike. The hawkish tone in the policy statement should indicate comfort with progress on the inflation and labor market fronts, as well as a bit of relief after seeing the Q3'16 US GDP reading.
As noted on September 27, "...with each passing day, the polls regarding the election will matter more and more to markets (stocks, bonds, FX—you name it), and in turn, speculation around the Fed will matter less and less.” I would strongly argue that the Fed has become a function of the election itself: the Fed funds futures' implied probability for a December rate hike is moving in tandem with Clinton election odds on betting sites and on poll aggregators like RealClearPolitics or FiveThirtyEight.
The implication for the Fed is clear. Forget the candidates' personalities and focus on the policies instead. The question to ask is, "Where would a President Clinton's fiscal policy be relative to the one currently in place by the Obama administration? What about under a President Trump?" Putting this on a bell curve, with the current Obama fiscal policy as the baseline, the results are clear: Clinton's plans reside close to the center of the bell curve; Trump's are out on the tail. Again, this is a relative basis; not a commentary on the efficacy of either candidates' policies.
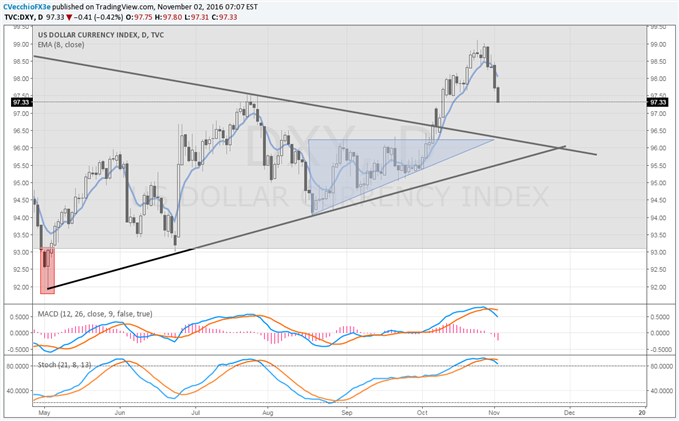
Chart 3: DXY Index Daily Chart (May 2016 to October 2016)
Considering this point of view, then, should Clinton be elected, the FOMC would likely be able to retain its current set of growth and inflation forecasts and continue with its current plan for normalizing rates (i.e., hike rates in December). However, given the significant shift in fiscal policy and its resulting impact on the US economy should Trump be elected (for better or for worse), the FOMC would have to go back to the drawing board and make sweeping adjustments to its forecasts. Such an event would cater to a hold in December; it's rather obvious then why the Trump rebound in the polls is hurting the US Dollar.
Continue tracking these setups and more throughout the week- Subscribe to more


