
USD/JPY Extends Rebound From Channel Support; RSI Follows Suit
(Click on image to enlarge)
|
Currency |
Last |
High |
Low |
Daily Change (pip) |
Daily Range (pip) |
|
1.3280 |
1.3346 |
1.3279 |
46 |
67 |
USD/CAD Daily
(Click on image to enlarge)
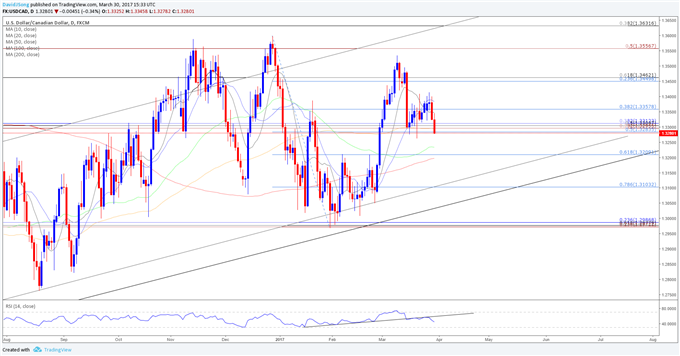
Chart - Created Using Trading View
- The Canadian dollar outperforms most of its major counterparts even as Bank of Canada (BoC) Governor Stephen Poloz tames interest-rate expectations and warns normalizing monetary policy prematurely would push the economy back into recession; the failed attempt to test the December high (1.3599) may fuel a larger decline in the exchange rate as the Relative Strength Index (RSI) fails to preserve the bullish formation from earlier this year.
- The broader outlook for USD/CAD remains supported by the upward trending channel carried over from the summer months, but the recent weakness in the exchange rate may gather pace going into April as the strength in the Canadian dollar appears to be accompanied by a pickup in crude; with oil prices trading back above $50/bbl, a material rebound in energy prices may limit the BoC’s scope to further support the Canadian economy especially as ‘recent consumption and housing indicators suggest growth in the fourth quarter of 2016 may have been slightly stronger than expected.’
- With that said, Canada’s Gross Domestic Product (GDP) report may have a limited impact on the monetary policy outlook even though the growth rate is expected to slow down to an annualized 1.9% in January, but the core reading for U.S. Personal Consumption Expenditure (PCE) may dampen the appeal of the greenback as the Fed’s preferred gauge for inflation is anticipated to hold steady at an annualized 1.7% for the third consecutive month in February.
- In turn, a break/close below the Fibonacci overlap around 1.3280 (50% retracement) to 1.3310 (38.2% retracement) may spur a run at the former-resistance zone around 1.3210 (61.8% retracement), with the next downside region of interest coming in around 1.3100 (78.6% retracement).
|
Currency |
Last |
High |
Low |
Daily Change (pip) |
Daily Range (pip) |
|
USD/JPY |
111.38 |
111.54 |
110.94 |
34 |
60 |
USD/JPY Daily
(Click on image to enlarge)
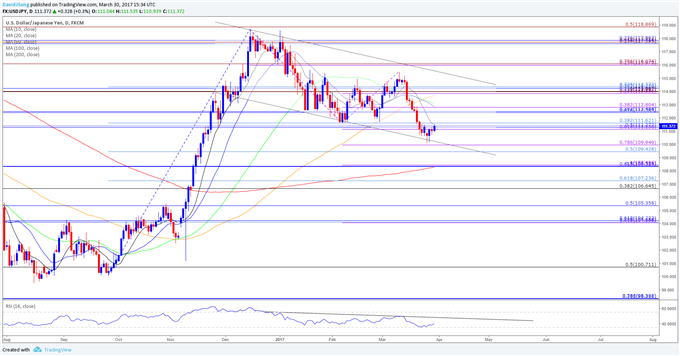
Chart - Created Using Trading View
- USD/JPY may continue to retrace the decline from earlier this month as the pair comes off of channel support and breaks the recent series of lower-highs & lows; the Relative Strength Index (RSI) also highlights a similar dynamic following the failed attempt to push into oversold territory, but the broader outlook for the dollar-yen exchange rate remains tilted to the downside as price & the oscillator preserve the bearish formations carried over from late-2016.
- Waning interesting-rate expectations may keep the dollar-yen exchange rate capped as Fed Fund Futures continue to price a less than 60% probability for a June rate-hike, but market participants may pay increased attention to the comments from New York Fed President William Dudley, a permanent voting-member on the Federal Open Market Committee (FOMC), as central bank officials still see scope for three to four rate-hikes in 2017; the fresh rhetoric may fuel the near-term rebound in USD/JPY should Mr. Dudley show a greater willingness to raise the benchmark interest rate sooner rather than later.
- With that said, the Nikkei (JPN225) appears to be trading at a similar juncture as the benchmark equity index bounces back from a monthly low of 18,867, and risk sentiment may continue to influence the near-term outlook for USD/JPY especially as the Bank of Japan (BoJ) pursues its Quantitative/Qualitative Easing (QQE) Program with Yield-Curve Control and keeps the door open to further support the real economy.
- Need a close above the Fibonacci overlap around 111.10 (61.8% expansion) to 111.60 (38.2% retracement) to favor a larger rebound in the dollar-yen exchange rate, with the next topside hurdle coming in around 112.40 (61.8% retracement) to 112.80 (38.2% expansion) followed by 113.80 (23.6% expansion) to 114.30 (23.6% retracement).
(Click on image to enlarge)
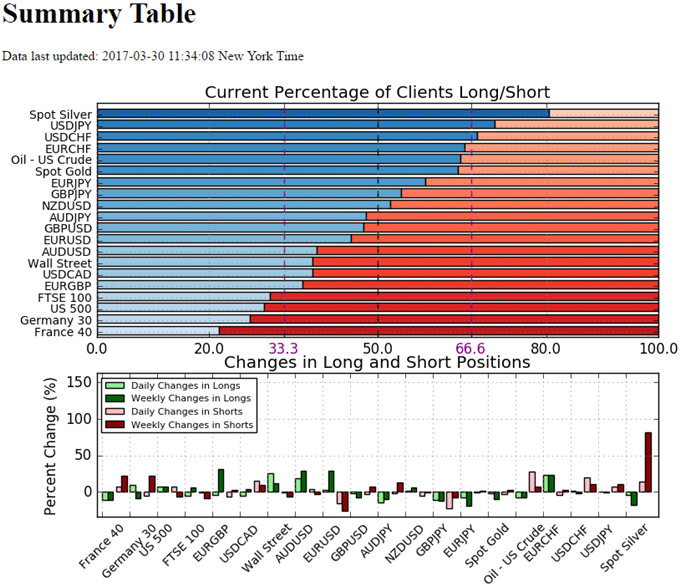
- The DailyFX Speculative Sentiment Index (SSI) shows retail positioning remains largely unchanged for the Japanese Yen, with the crowd net-long USD/JPY since January 9.
- Retail trader data shows 70.8% of traders are net-long USD/JPY with the ratio of traders long to short at 2.42 to 1. The number of traders net-long is 0.2% lower than yesterday and 1.1% lower from last week, while the number of traders net-short is 7.1% higher than yesterday and 11.0% higher from last week.
- Retail trader data shows 38.4% of traders are net-long USD/CAD with the ratio of traders short to long at 1.6 to 1. The number of traders net-long is 5.3% lower than yesterday and 4.1% higher from last week, while the number of traders net-short is 15.6% higher than yesterday and 9.8% higher from last week.
(Click on image to enlarge)
Disclosure: Are retail traders buying or selling the US Dollar, and what does say about the trend more
How did you like this article? Let us know so we can better customize your reading experience.

Comments
Leave a comment to automatically be entered into
our contest to win a free Echo Show.

