
USD/JPY Builds Bearish ABC Pattern In Wave E Triangle
USD/JPY
4 hour
(Click on image to enlarge)
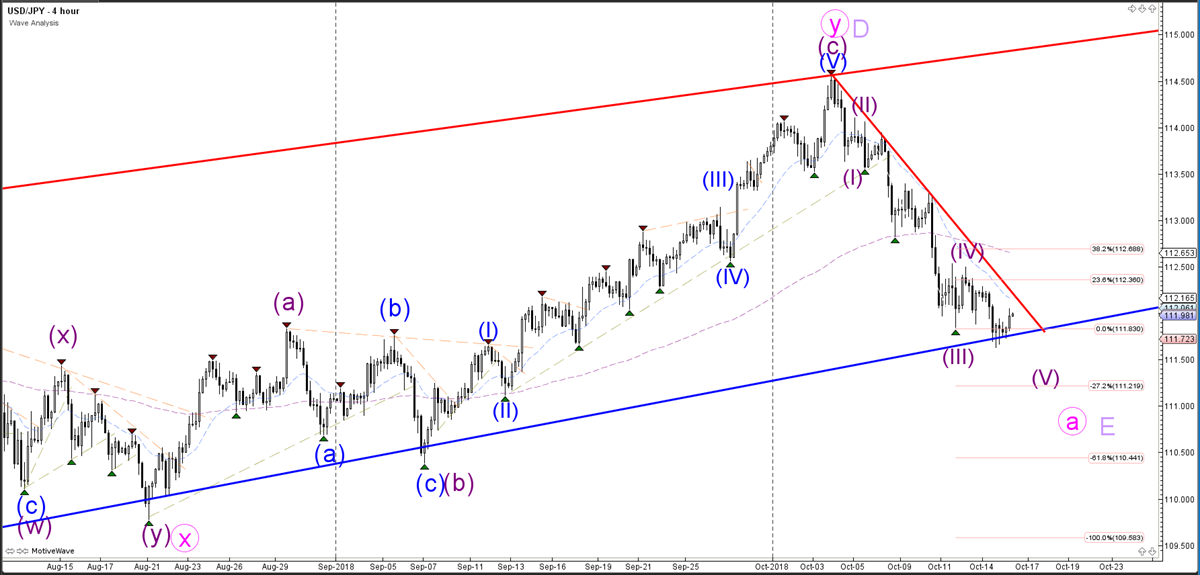
Source: Admiral Markets MT5 with MT5SE Add-on USD/JPY motive wave – Accessed 16 October 2018 at 4:00 AM GMT
The USD/JPY currency pair made a new low yesterday, which is probably part of a bearish wave 5 (purple) of a larger wave A (pink). The main target of the 5th wave (purple) is the -27.2% Fibonacci level at 111.21. The bearish price action is probably part of an ABC zigzag pattern (pink) within wave E (purple).
1 hour
(Click on image to enlarge)
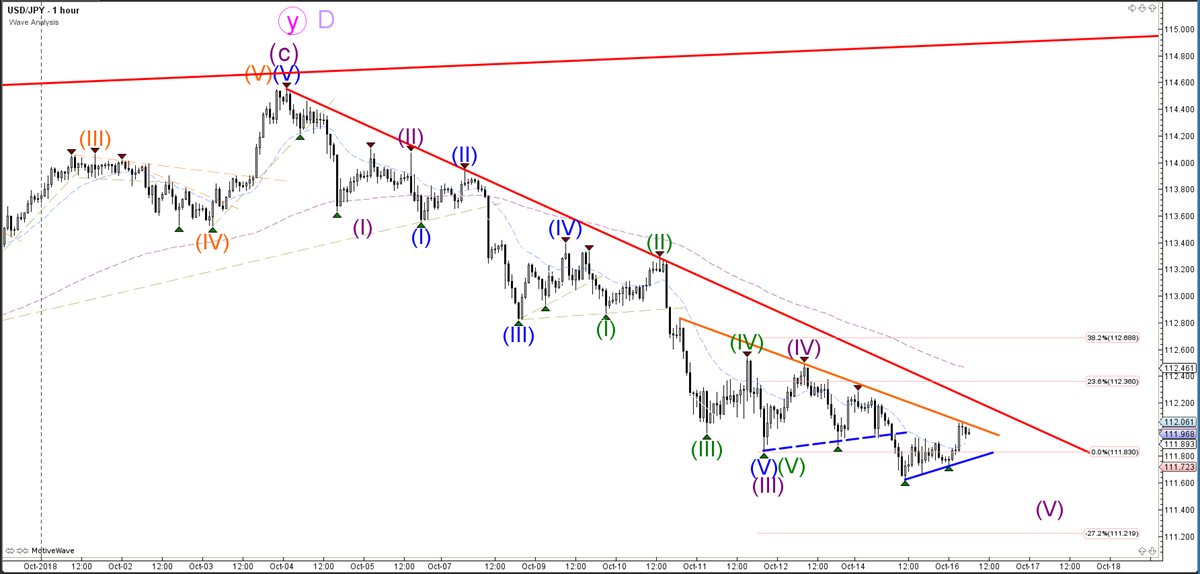
Source: Admiral Markets MT5 with MT5SE Add-on USD/JPY motive wave – Accessed 16 October 2018 at 4:00 AM GMT
The USD/JPY currency pair broke below the support trend line (dotted blue), but bullish candlestick patterns are probably indicating a retracement within the downtrend. A break above the resistance trend lines, however, could indicate an uptrend.
Daily
(Click on image to enlarge)
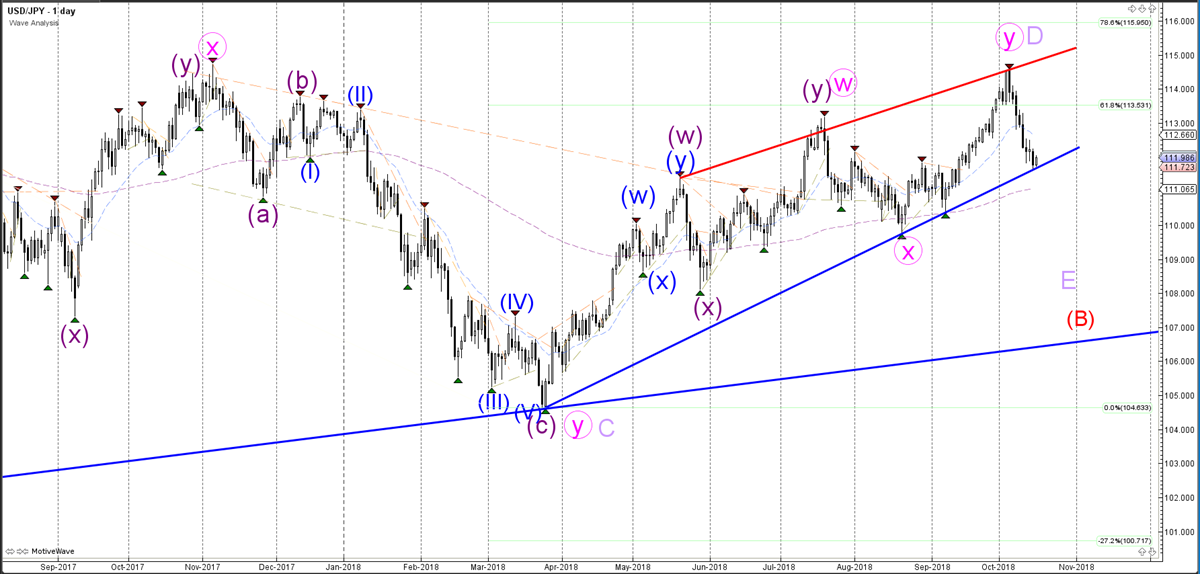
Source: Admiral Markets MT5 with MT5SE Add-on USD/JPY motive wave – Accessed 16 October 2018 at 4:00 AM GMT
The USD/JPY currency pair has reached a potential support zone, which offers a potential breakout or bounce.
Disclaimer: The opinions in this article are for informational and educational purposes only and should not be construed as a recommendation to buy or sell the stocks mentioned or to solicit ...
more

