
USD/CAD – Happy And Profitable Bears
Yesterday, the U.S. dollar moved sharply lower against its Canadian counterpart, which took the exchange rate to our next downside target. Thanks to the seller’s attack, we noticed a potential pro-bearish formation on the horizon, which can make positions even more profitable…
EUR/USD – Breakdowns and Their Implications
(Click on image to enlarge)
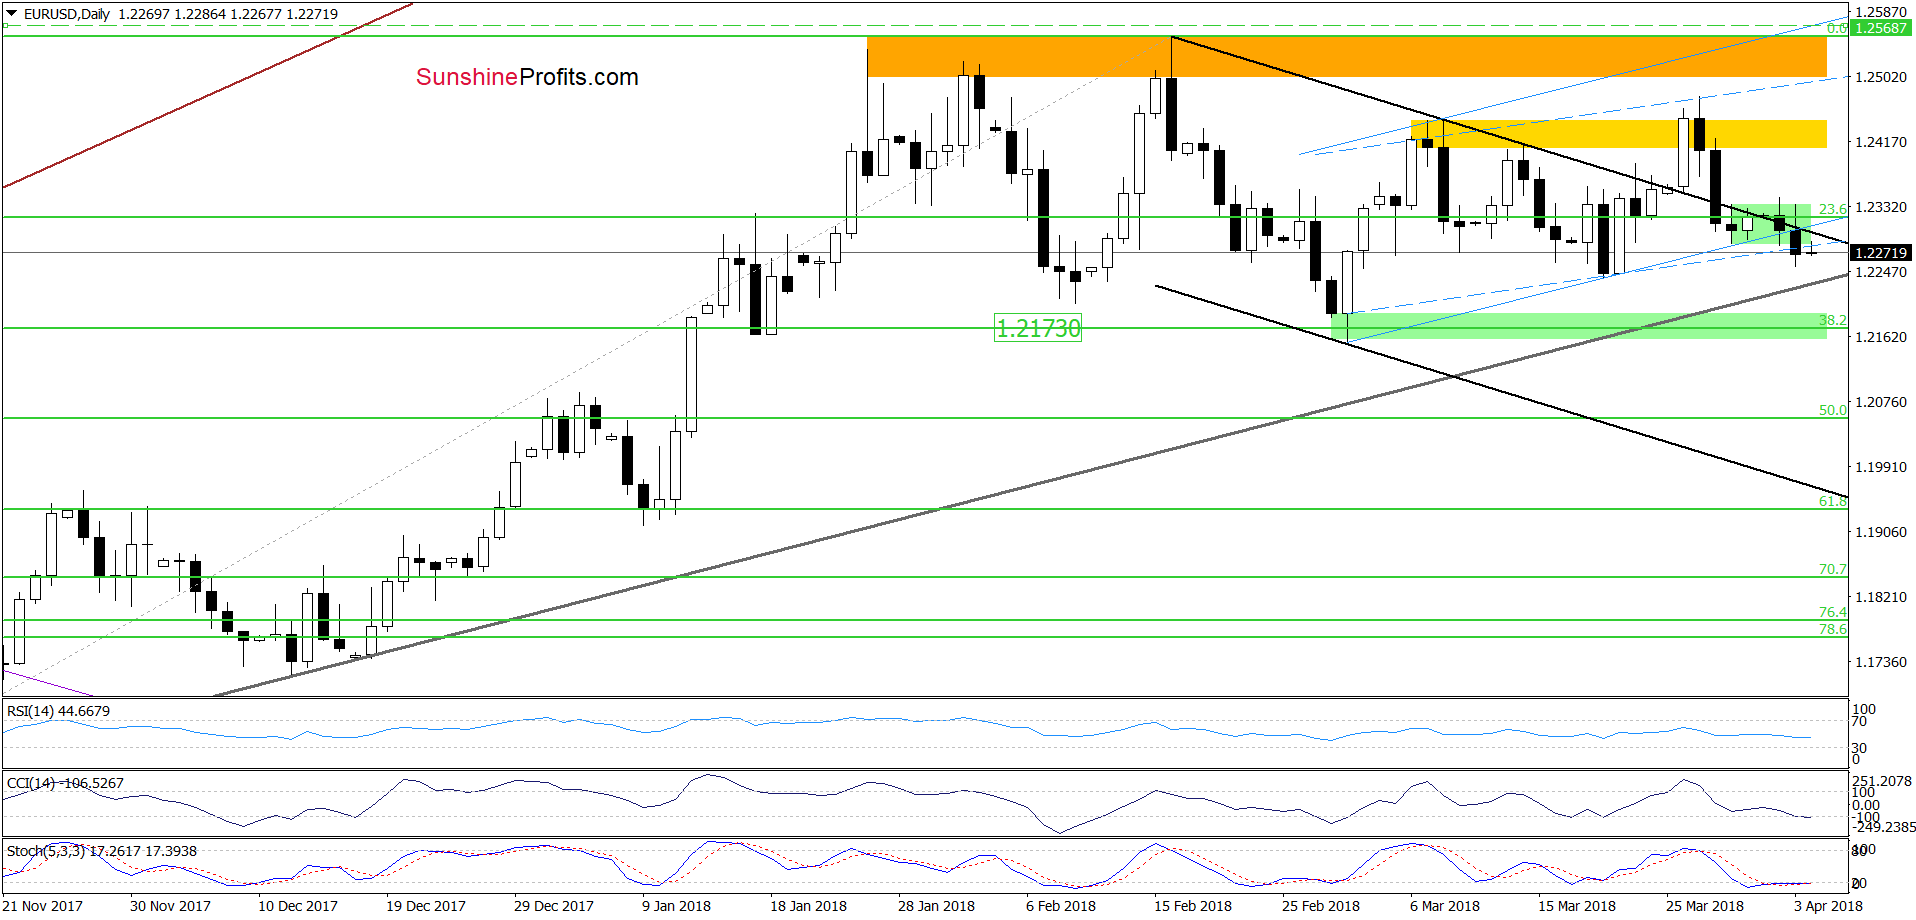
Yesterday, we wrote that although EUR/USD came back above the previously-broken upper border of the black declining trend channel, the pair is still trading inside the green consolidation slightly below the 23.6% Fibonacci retracement.
What does it mean for the exchange rate? In our opinion, as long as there is no daily closure above the upper line of the formation and the black support/resistance line another move to the downside and a test of the green support zone is likely.
From today’s point of view, we see that currency bears didn’t disappoint us and pushed EUR/USD lower, invalidating the earlier tiny breakout above the upper border of the black declining trend channel during Tuesday’s session.
Thanks to yesterday’s drop the pair also closed the day under the lower line of the green consolidation and the lower border of the blue rising trend channel (not only in terms of intraday lows, but also in terms of daily openings), which doesn’t bode well for currency bulls – even if we factor in the fact that the daily indicators are oversold (as a reminder, they have lied many times in the past).
What’s next for the exchange rate?
Taking all the above into account, we think that the pair will test not only the medium-term support line based on the November and December 2017 lows, but also the 38.2% Fibonacci retracement and the green support zone in the coming day(s).
USD/JPY vs. Short-term Resistance
(Click on image to enlarge)
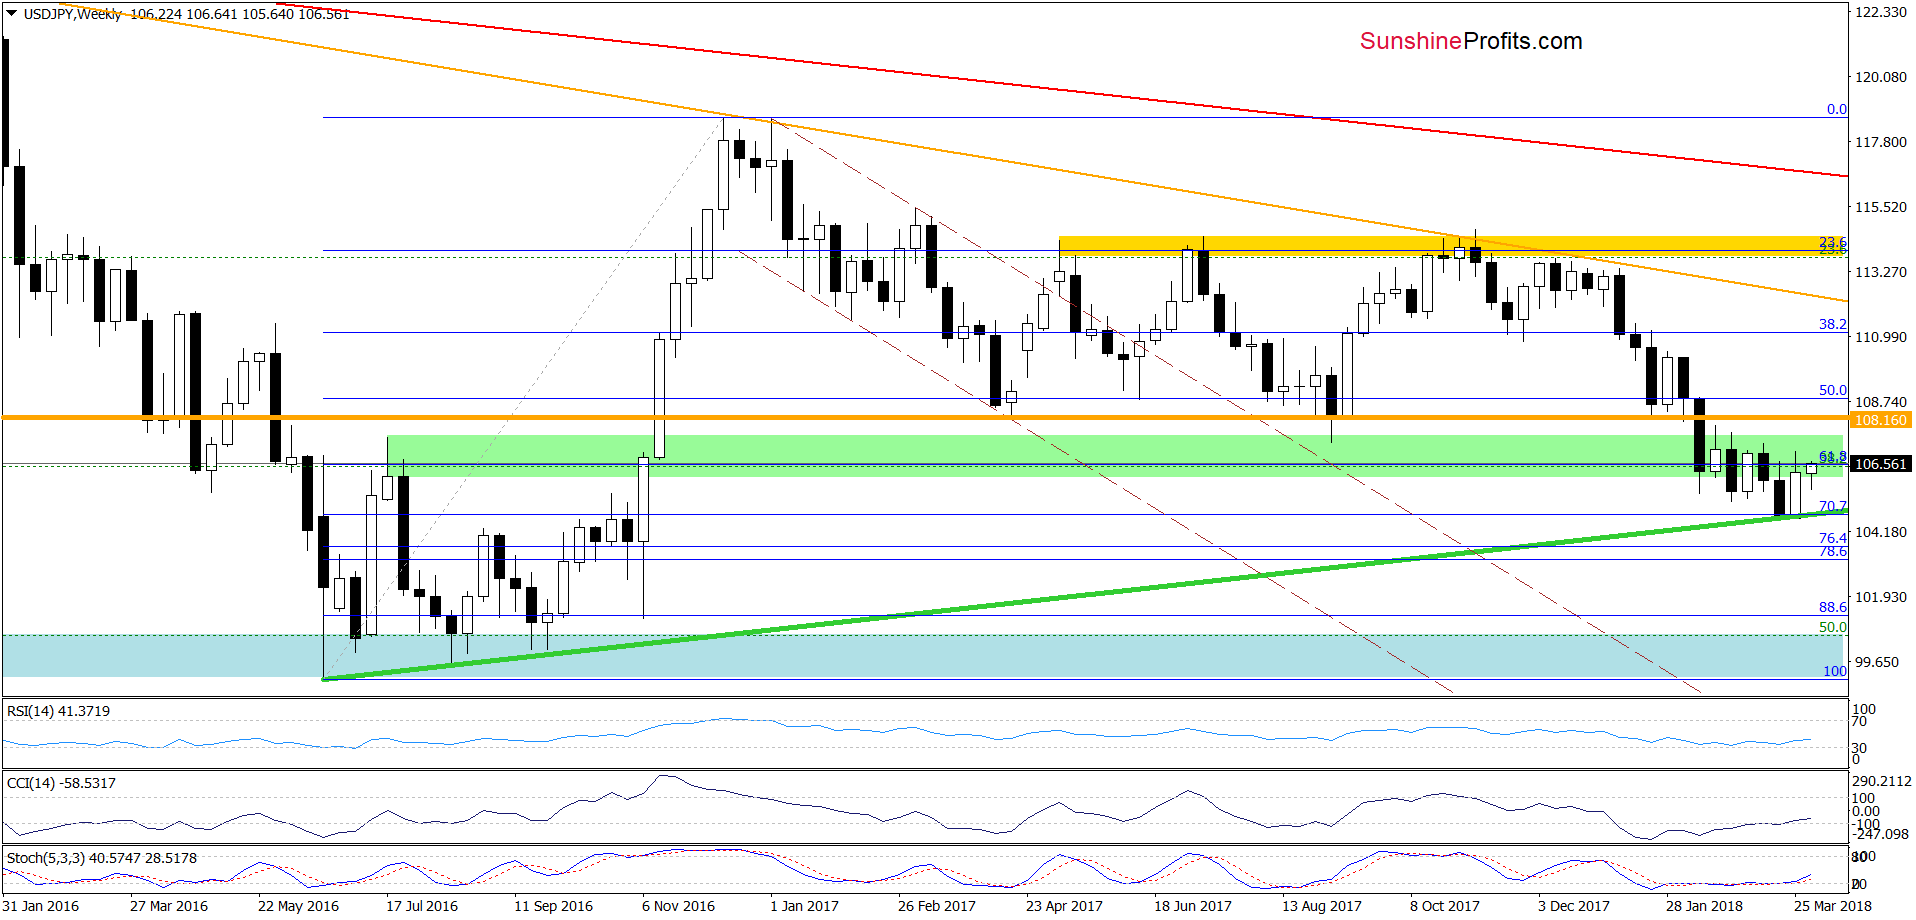
Looking at the weekly chart, we see that although USD/JPY pulled back in the previous week, currency bulls didn’t give up and try to push the pair higher this week. The buy signals generated by the indicators suggest further improvement, but will we see a bigger move to the upside?
(Click on image to enlarge)
(Click on image to enlarge)
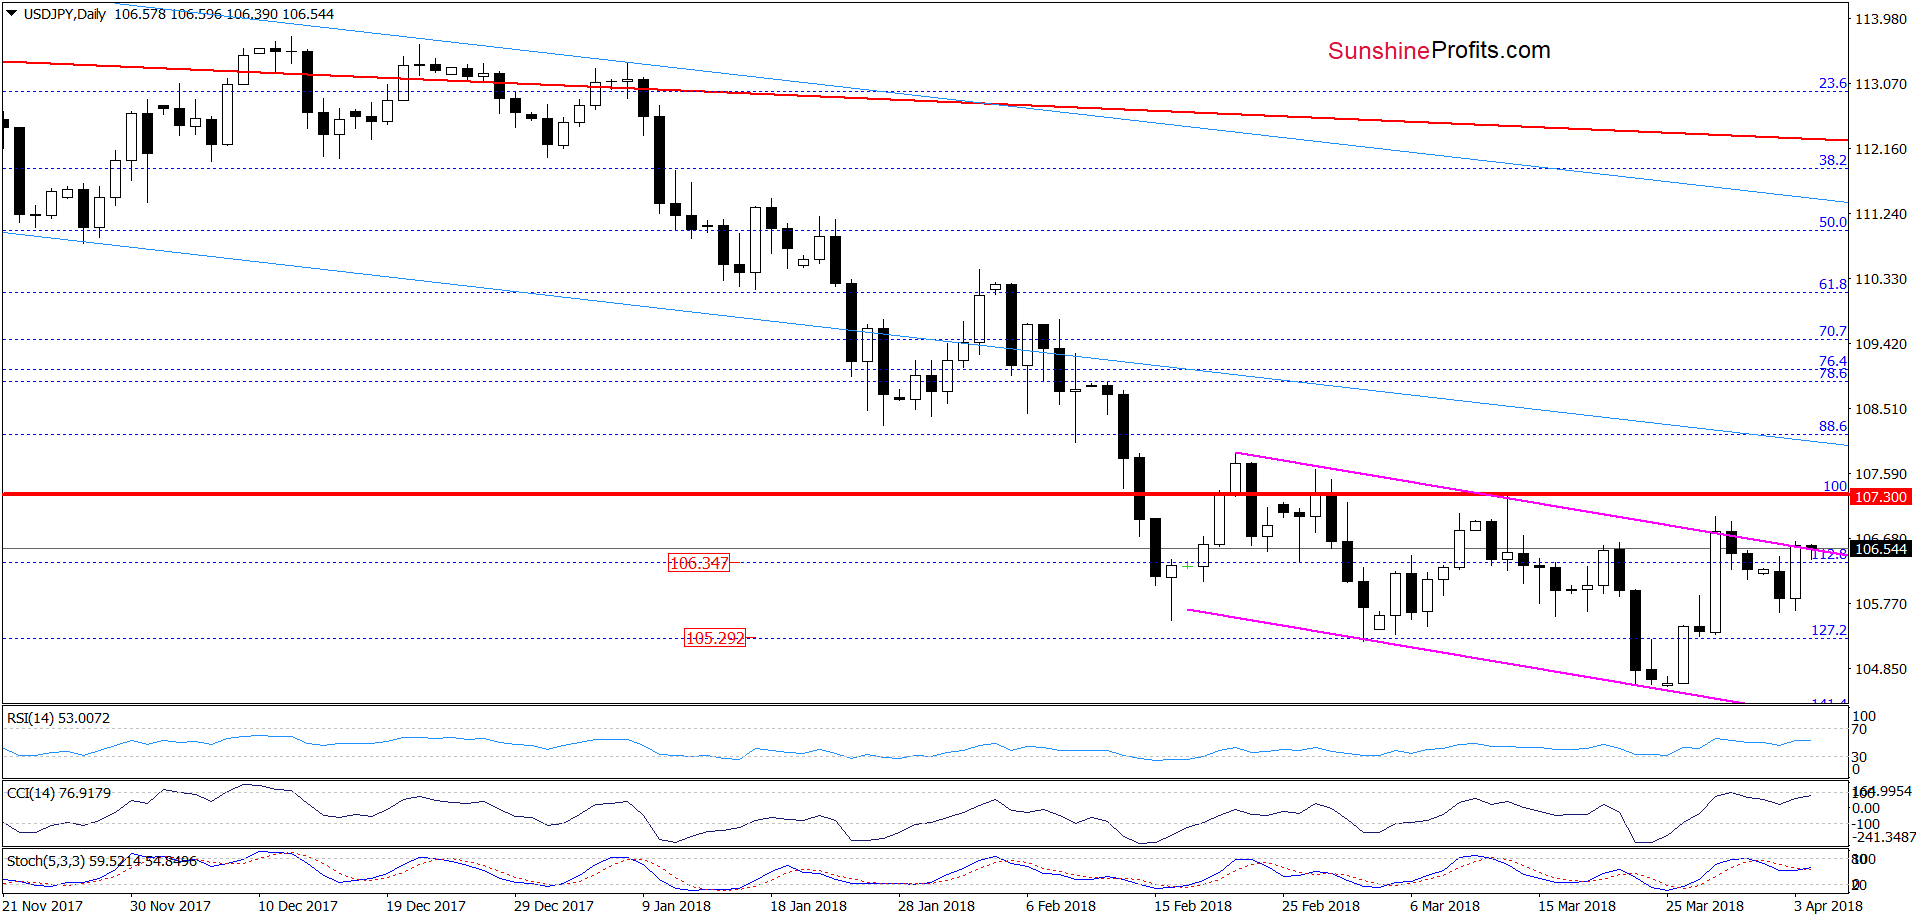
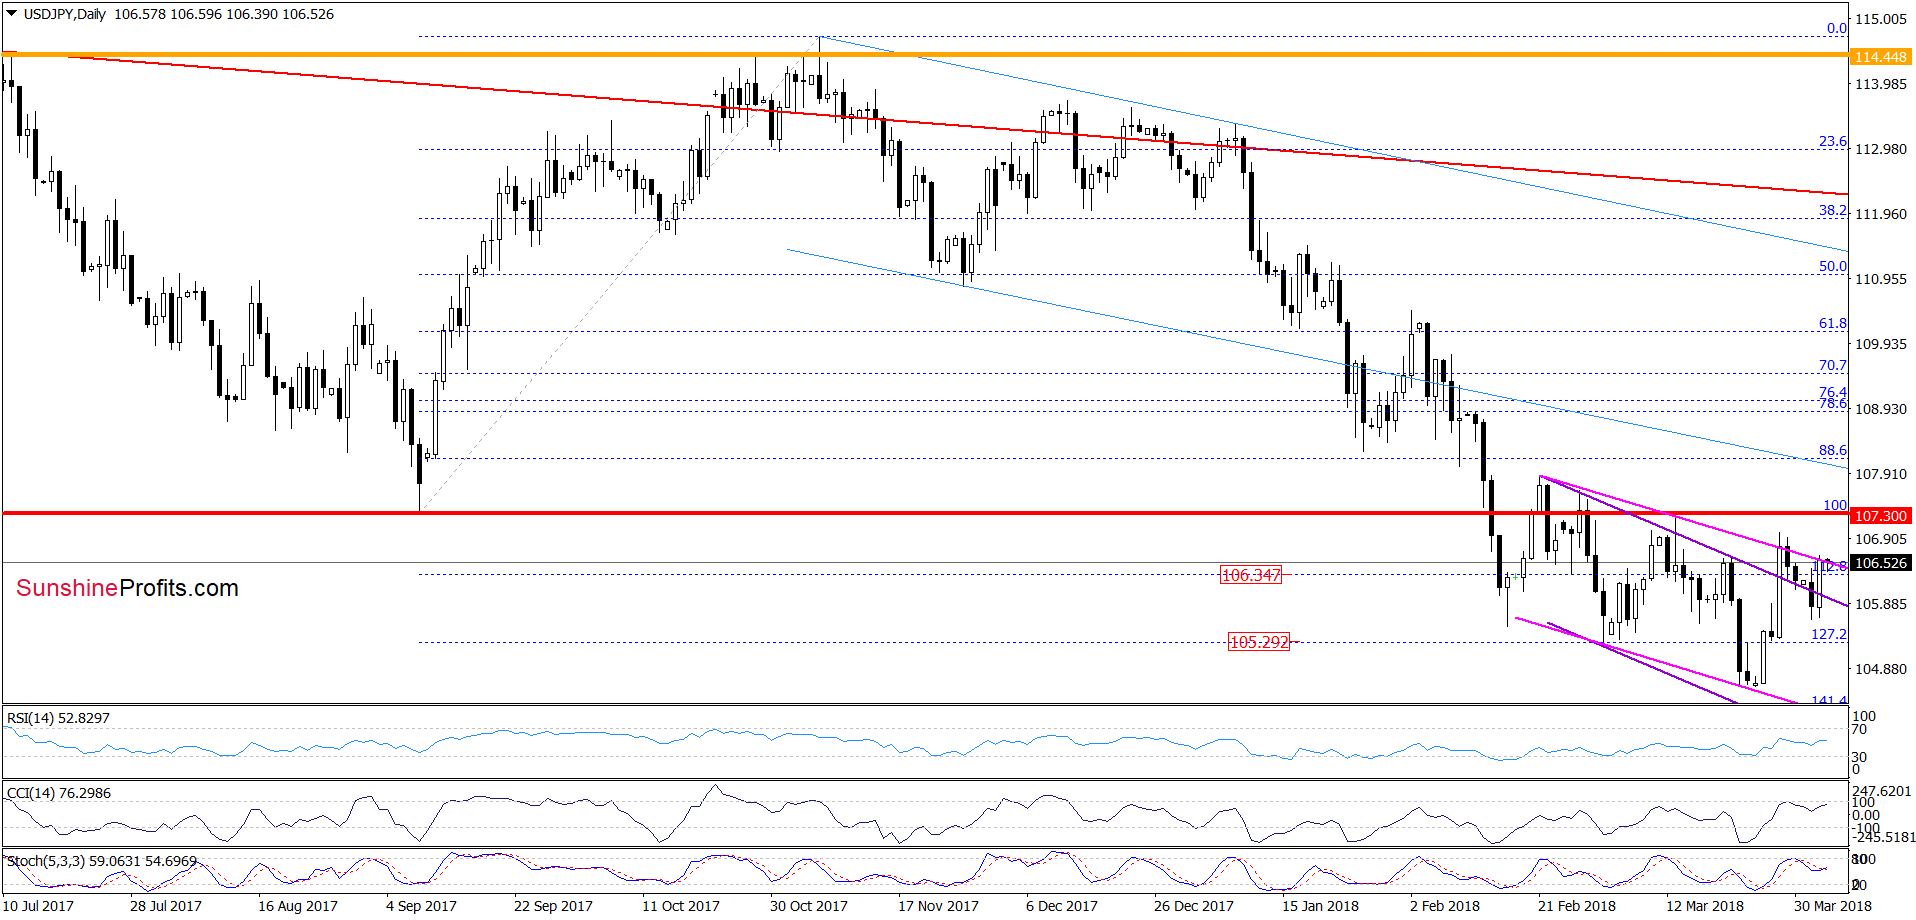
In our opinion, such price action will be more likely only if USD/JPY breaks above the upper border of the purple declining trend channel. Nevertheless, in our opinion, further rally will be more reliable if the exchange rate climbs above late February high of 107.88 and invalidates the earlier breakdown under the red horizontal line based on the September low of 107.30.
Until this time, short-lived moves in both directions should not surprise us. Therefore, waiting at the sidelines for another opportunity remains the best decision.
USD/CAD Rewards Bears
(Click on image to enlarge)
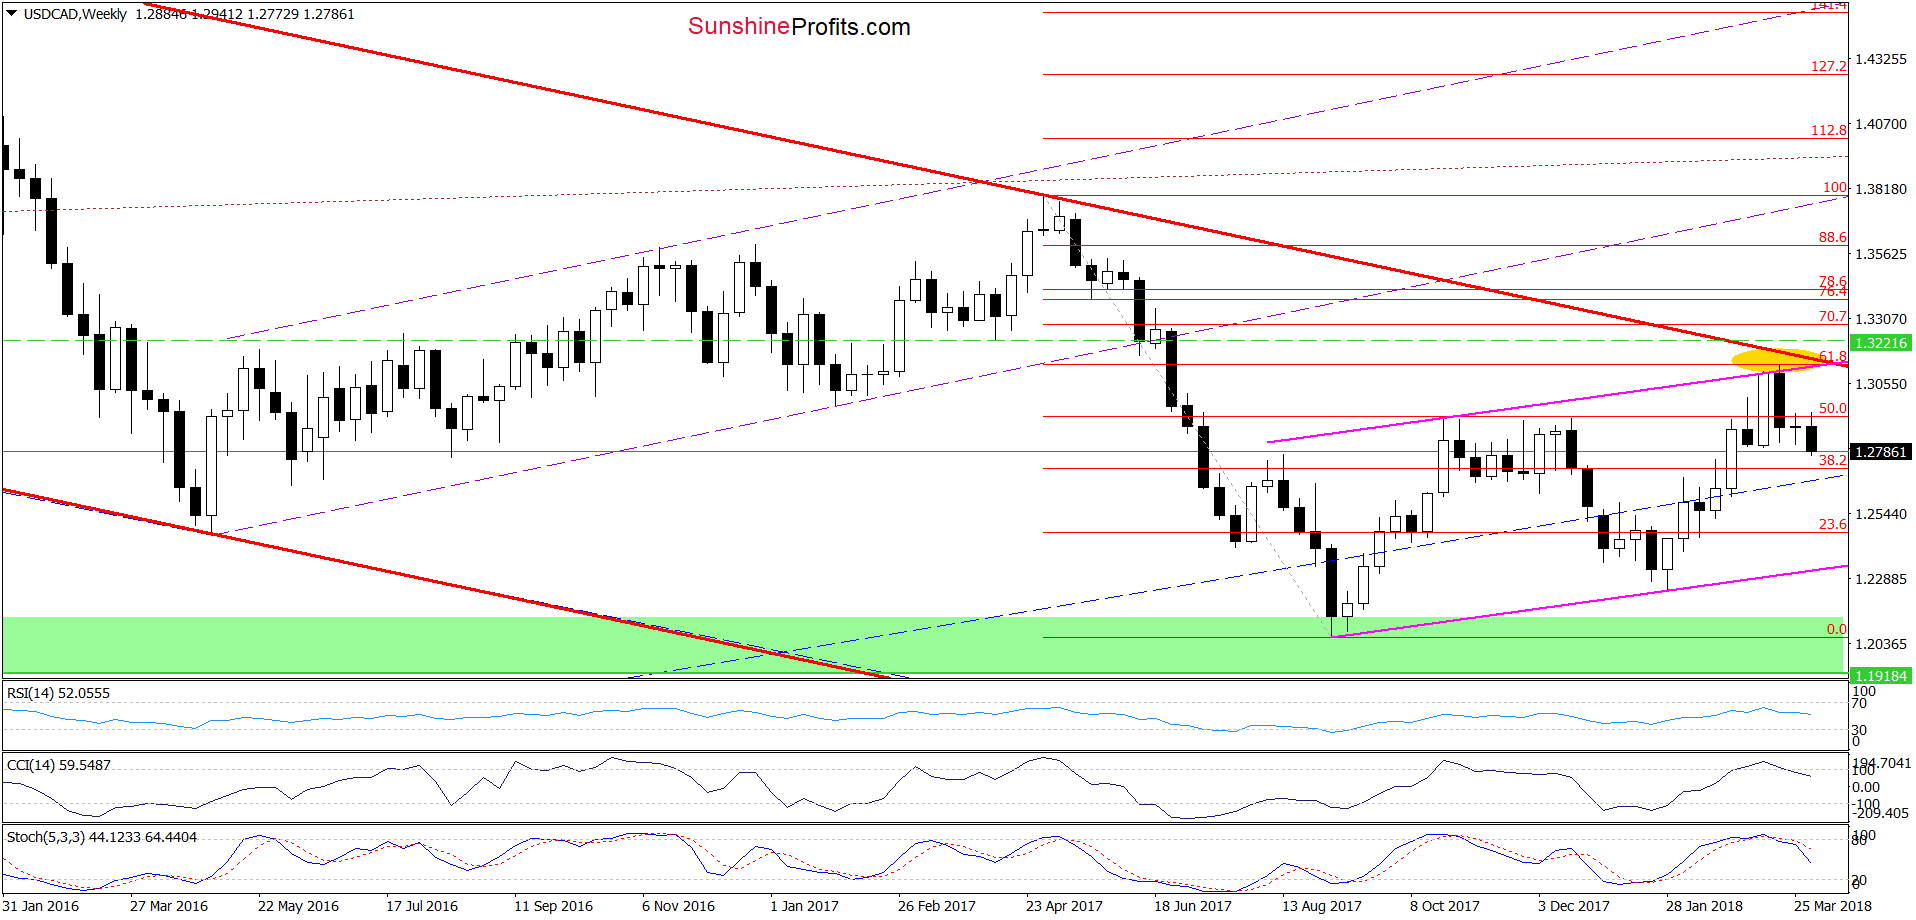
Looking at the medium-term chart, we see that although USD/CAD moved a bit higher earlier this week, currency bears took control quite quickly, which resulted in another move to the downside. Additionally, the sell signals generated by the weekly indicators remain in the cards, supporting currency bears and lower values of the exchange rate.
Are there any short-term factors that could thwart these plans?
(Click on image to enlarge)
Before we answer to this question, let’s recall the quote from our last commentary on this currency pair:
(…) although USD/CAD bounced off the blue support zone, the pair is still trading in the green consolidation around the yellow resistance zone and well below the previously-broken lower border of the green rising trend channel.
What does it mean for the exchange rate? In our opinion, as long as the pair remains under the upper border of the formation, another attempt to move lower is very likely.
If this is the case and USD/CAD extends losses from here, we’ll see (at least) a re-test of the blue support zone in the coming days, which will make our short positions even more profitable (as a reminder, we opened them on March 19, when USD/CAD was trading at around 1.3116).
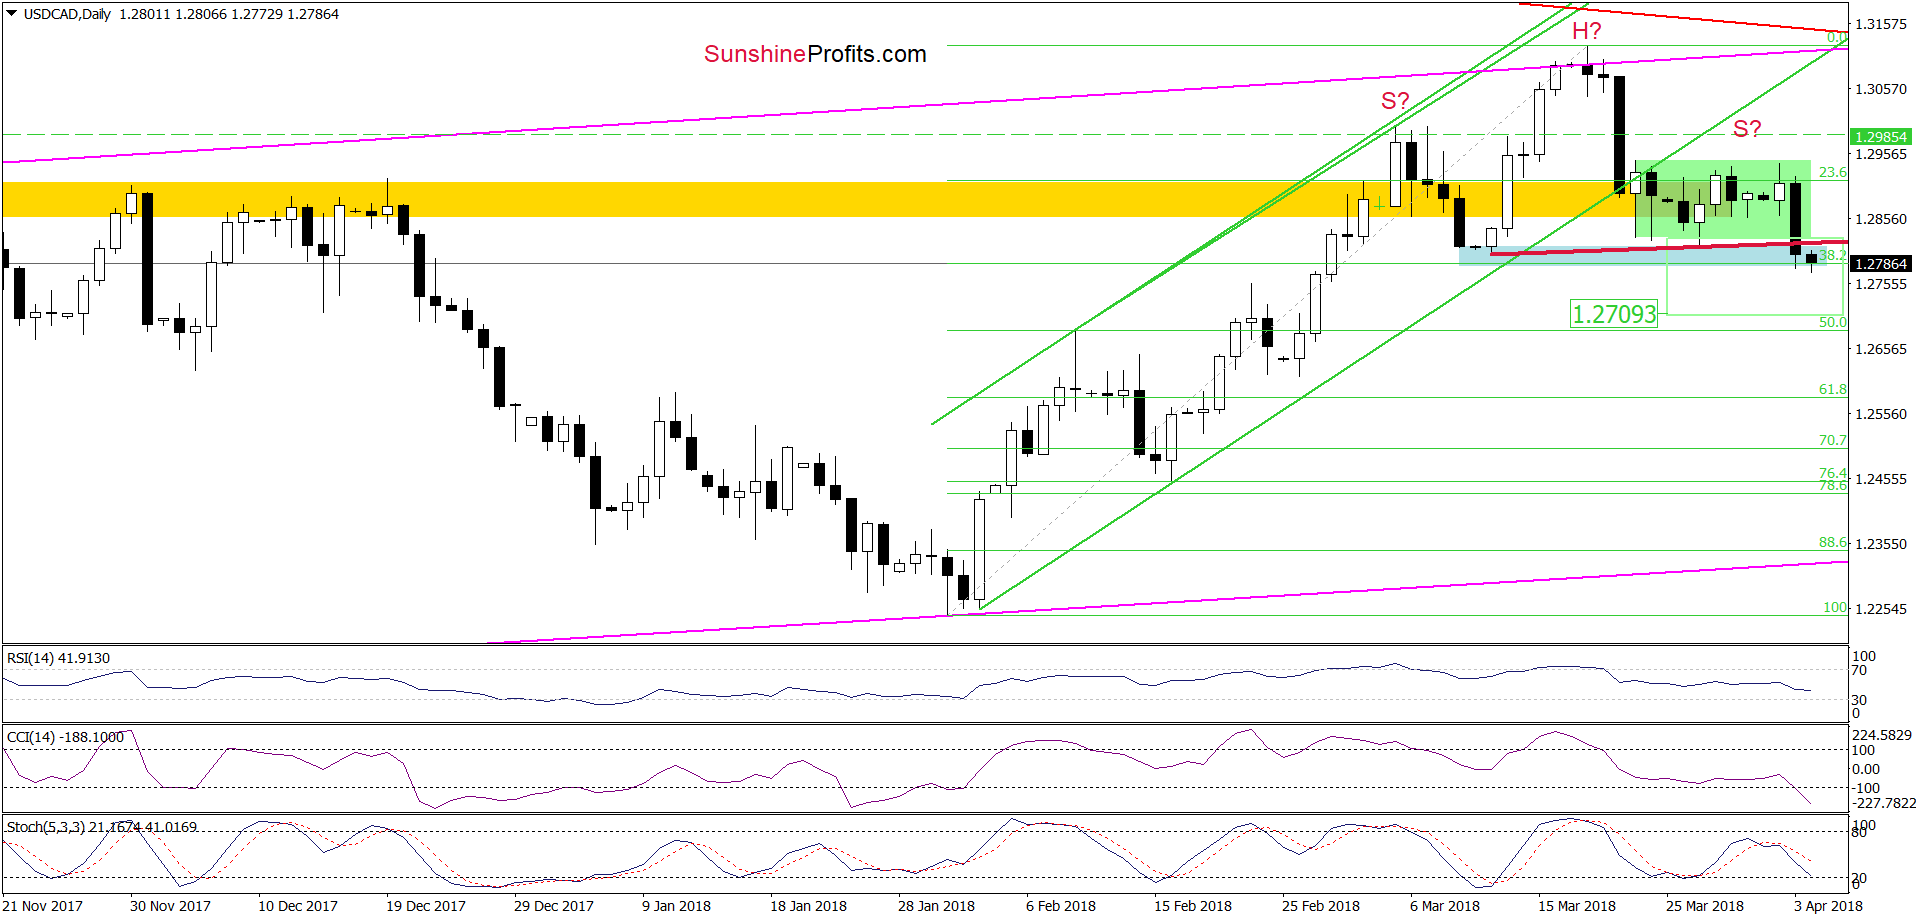
As you see on the daily chart, the situation developed in tune with our assumptions and USD/CAD declined sharply after unsuccessful attempt to break above the upper border of the green consolidation. Thanks to yesterday’s downswing, the pair dropped under the lower line of this formation and reached our next downside target - the blue support zone and the 38.2% Fibonacci retracement.
Although this support area could trigger a rebound, the sell signals generated by the indicators remain in the cards, which together with yesterday’s breakdown suggest further deterioration and a drop to around 1.2709, where the size of the move will correspond to the height of the green consolidation.
And speaking about the bearish potential… Looking at the daily chart, you probably already noticed a potential head and shoulders formation. You're right, the right arm of the pattern doesn’t look perfectly like in technical analysis books, but yesterday’s downswing took the exchange rate under the neck line of the formation, increasing the probability of a bigger move to the downside. Nevertheless, in our opinion, such price action will be more likely and reliable if USD/CAD falls below the blue support zone. In this case, the likelihood of a decline under the above-mentioned downside target will increase significantly.
So, how low could the exchange rate go if the situation develops in line with the pro-bearish scenario?
(Click on image to enlarge)
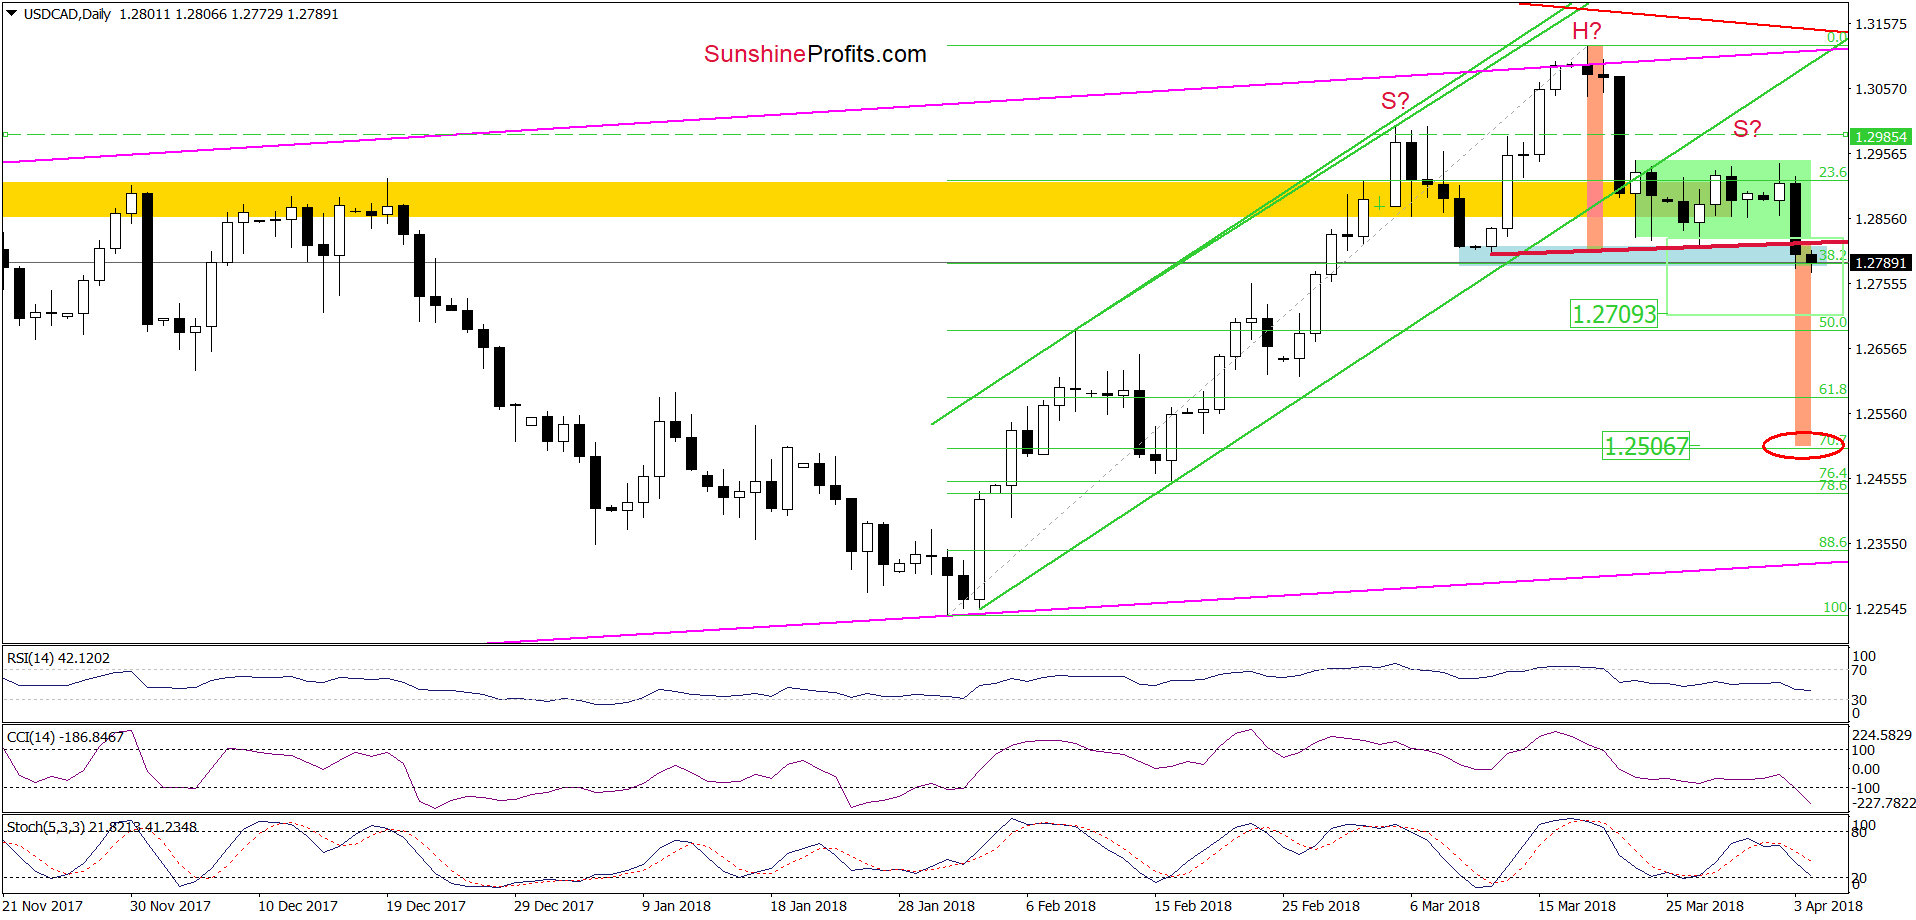
In our opinion, the next downside target will be around 1. 2506, where the size of the downward move will correspond to the height of the head and shoulders formation. Nevertheless, before we see the pair at this level, currency bears will have to break under 50% and 61.8% Fibonacci retracements first. Therefore, we will continue to monitor the market and keep our subscribers informed should we see a confirmation/invalidation of the above.
USD/CHF Between Important Lines
(Click on image to enlarge)
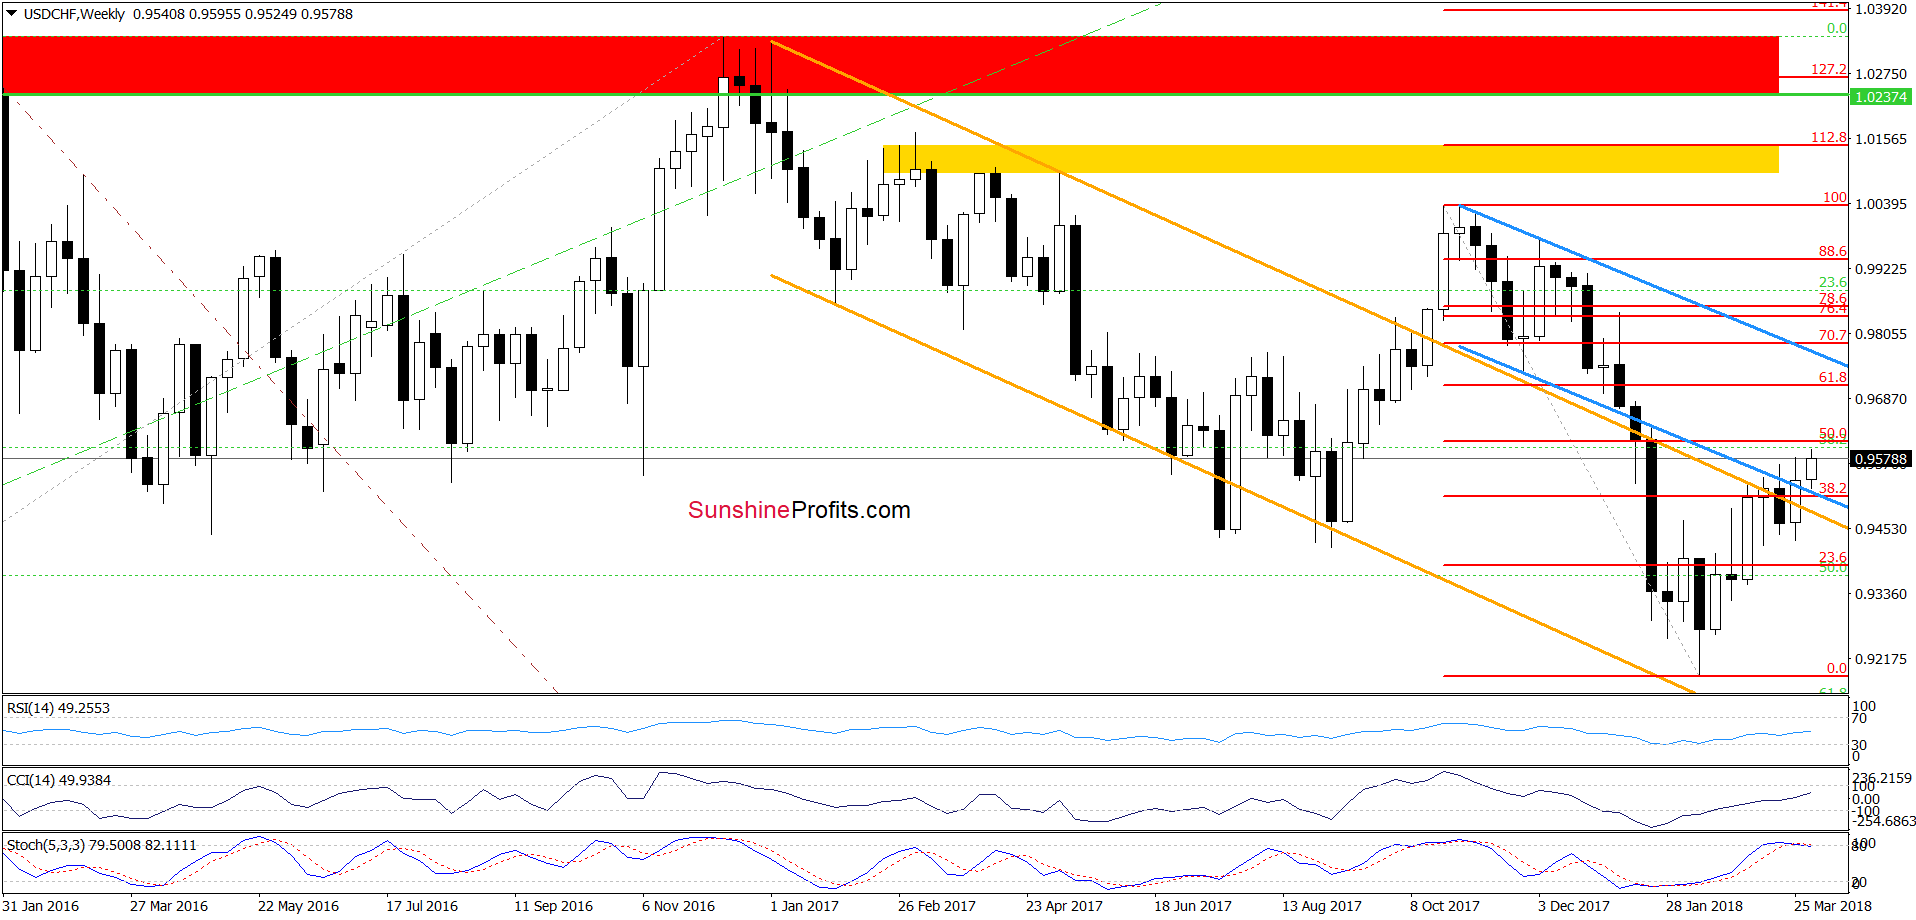
Looking at the medium-term chart, we see that USD/CHF is still trading above the previously-broken resistance zone created by the upper line of the orange declining trend channel, the lower border of the blue declining trend channel and the 38.2% Fibonacci retracement. Although this is a bullish signal, we noticed some disturbing factors on the horizon, which could thwart these plans.
What do we mean by that? First, the exchange rate moved higher earlier this week, but currency bulls didn’t manage to push it above the 50% Fibonacci retracement, which resulted in a pullback. Second, the weekly Stochastic Oscillator generated the sell signal. Third, thanks to yesterday’s increase the pair climbed to the previously-broken lower border of the blue rising trend channel, but there was no breakout above it, which suggests that this move could be a verification of the earlier breakdown.
(Click on image to enlarge)
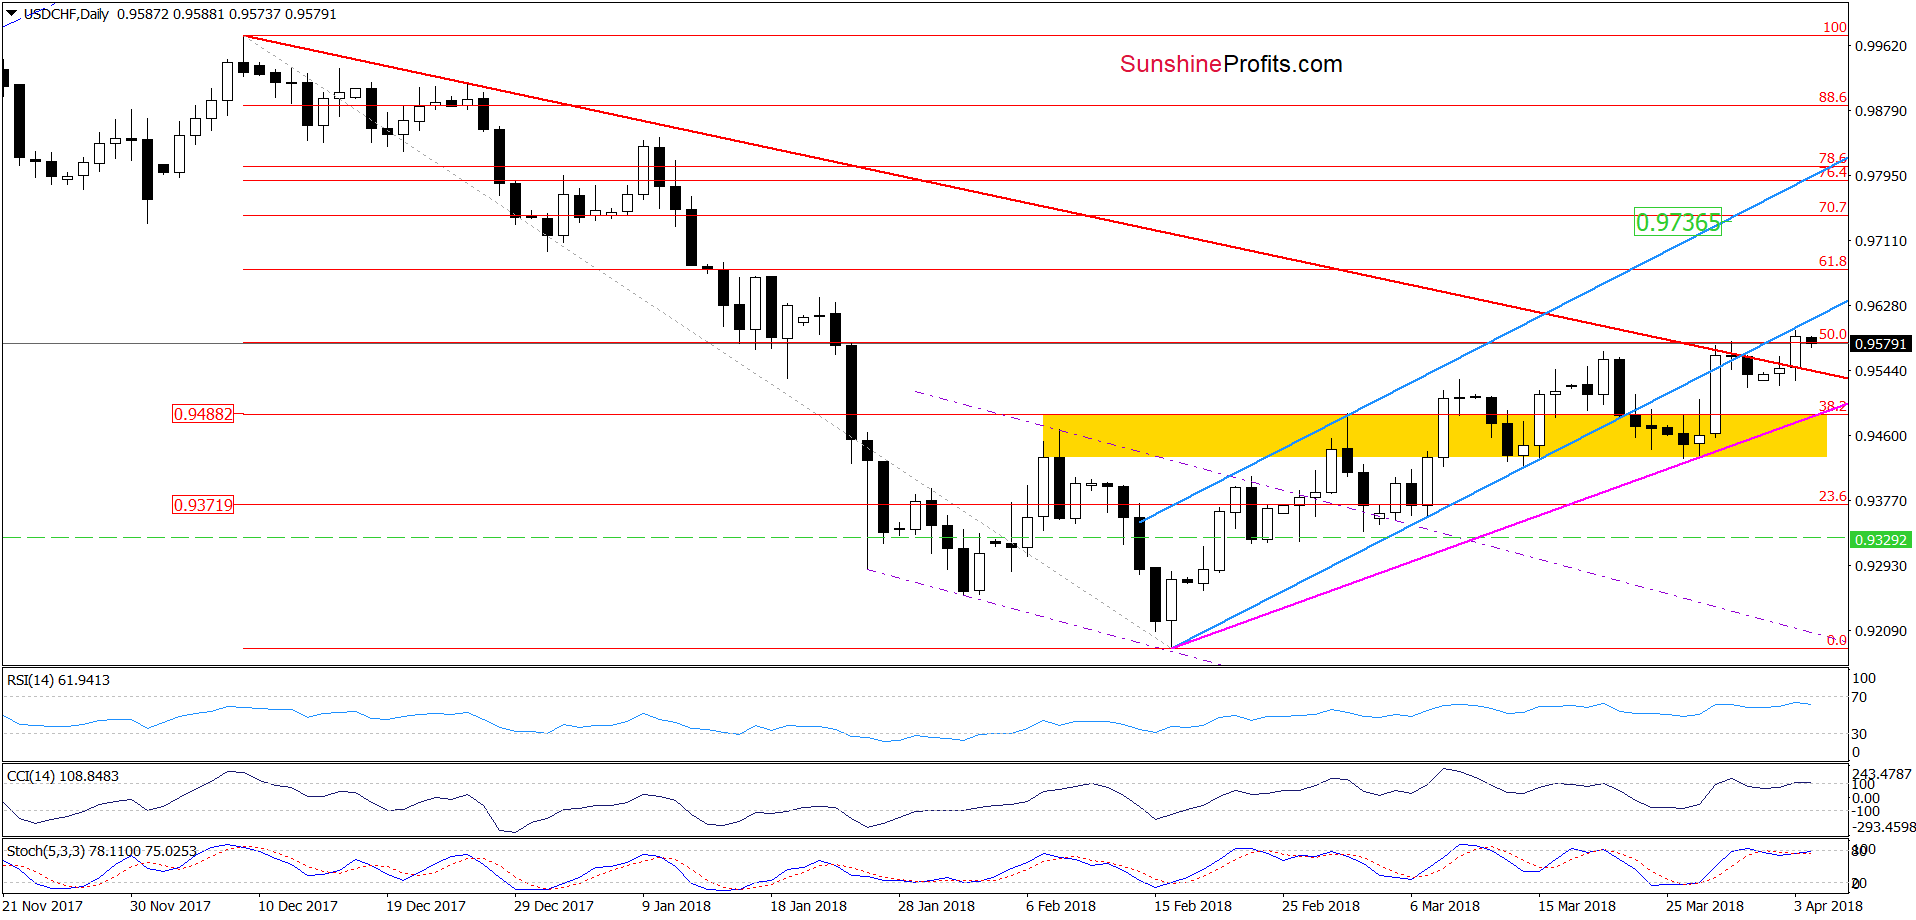
Additionally, the current position of the daily indicators suggests the next move will be likely to the downside as the generation of sales signals is just around the corner. If this is the case, the pair could decline to the previously-broken red declining line (which serves as the nearest support) or even to the pink support line based on the previous lows, which intersects the yellow support zone now.
What’s New in the USD Index?
Finishing today’s Forex Trading Alert, we decided to take a closer look at the current situation in the USD Index.
(Click on image to enlarge)
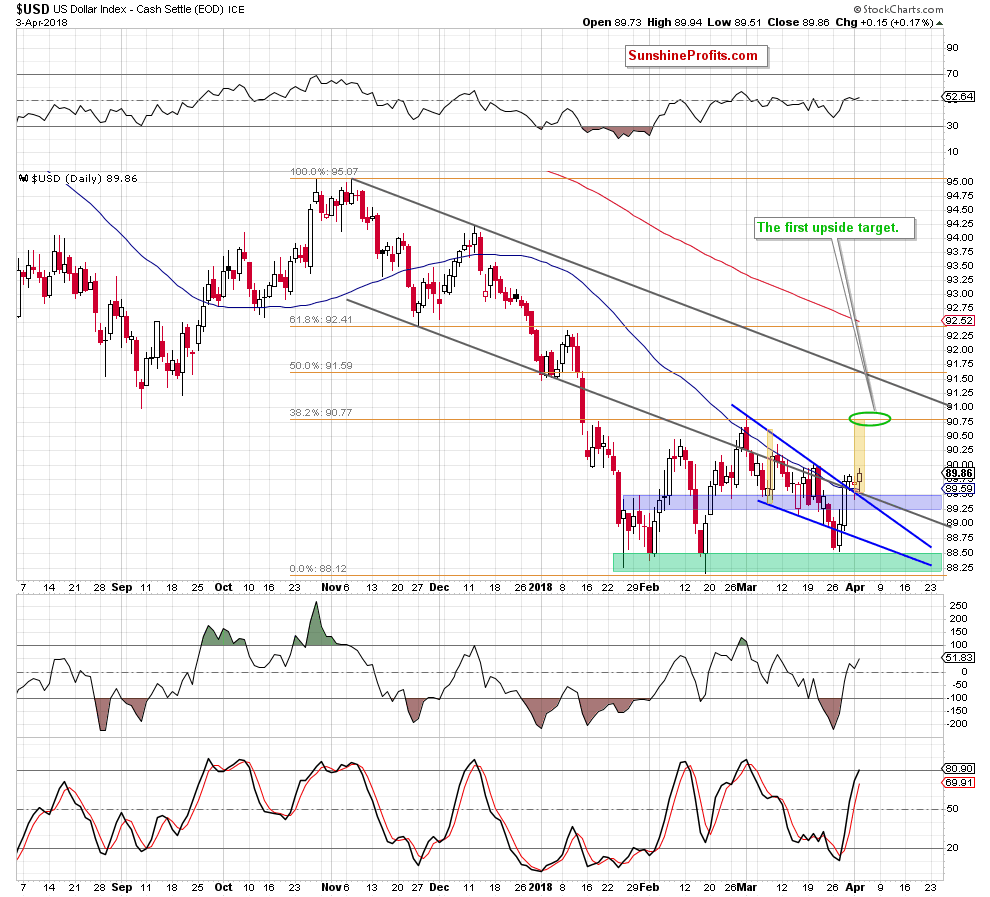
From the short-term point of view, we see that the greenback came back above two important resistance lines – the previously-broken lower border of the black declining trend channel and the upper line of he blue declining wedge.
Yesterday, the index verified this breakout, which together with the buy signals generated by the indicators suggest further improvement.
How high could the U.S. dollar go in the coming day(s)?
In our opinion, the first upside target will be around 90.77, where the 38.2% Fibonacci retracement and the March peak are. Additionally, in this area the size of the upward move will correspond to the height of the rising wedge (we marked it with the green ellipse), which increases the probability of the pro-bullish scenario in near future.
If this is the case and the index climbs to our first upside target, we’ll also see a realization of the bearish scenario in the case of EUR/USD as the exchange rate will test the March low and our downside target at 1.2173.


