
US Underperformance Vs. Rest Of World, Emerging Markets
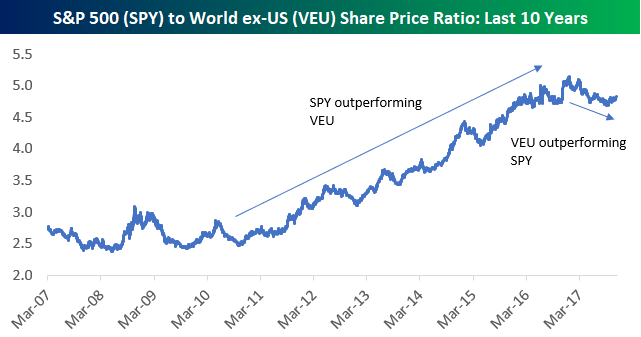
One of the easiest ways to track the relative equity-market performance of the US versus the rest of the world is to take the ratio of SPY to VEU. SPY tracks the S&P 500, while VEU tracks the FTSE All-World ex-US index. As shown in the chart below, when the line for this ratio is rising, the US is outperforming the rest of the world.When the line is falling, the US is underperforming.
After outperforming from 2011 through 2016, we’ve finally seen the US go through a period of underperformance versus the rest of the world in 2017. If this new trend of underperformance by the US lasts as long as the prior trend of outperformance, investors will certainly be better off rotating into non-US equity index ETFs.
(Click on image to enlarge)
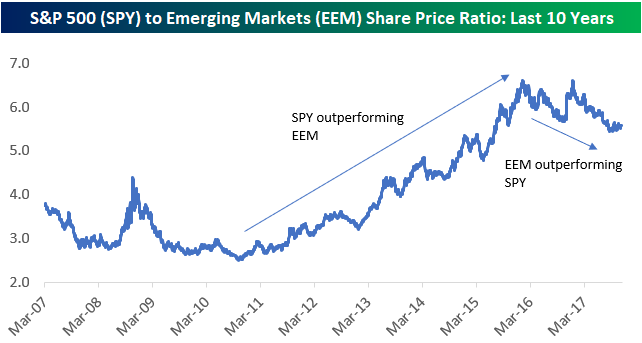
A similar trend has taken shape for emerging markets specifically versus the US. Only this trend of outperformance by emerging markets began a year earlier back in early 2016 than it did for the All World ex-US ETF.
(Click on image to enlarge)
Disclaimer: To begin receiving both our technical and fundamental analysis of the natural gas market on a daily basis, and view our various models breaking down weather by natural gas demand ...
more

