U.S. Treasuries: A Steep Learning Curve
Just when everyone thought they had the U.S. Treasury (UST) yield curve all figured out, the unexpected happens. Yes, as the calendar turned to autumn, the Treasury yield construct decided to do a 180 from its predominant flattening pattern—and actually re-steepen. Quite simply, the lesson learned here is that bond market trends do not always move uniformly in one direction. Yes, the overarching theme may remain in place, but getting to that end goal oftentimes entails a curveball (sorry for the pun, but I couldn’t resist).
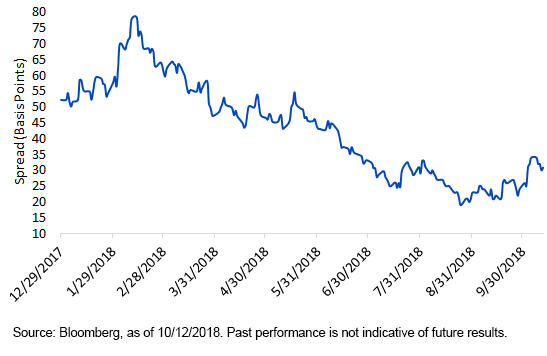
OK, so where does that leave us? Well, let’s take a look at recent developments and put things into perspective. After hitting a low point of 19 basis points (bps) on August 24, the UST 2-Year vs 10-year spread widened back out to 34 bps just last week, no doubt a by-product of the widely publicized sell-off that was more targeted toward longer-dated maturities. Even with this 15 bps re-steepening UST, 2s/10s still resides at the lowest levels since 2007.
U.S. Treasury 2-Year vs. 10-Year

Does the latest yield curve development mean the flattening trend is over? Interestingly, some of the key reasons why the curve had flattened up until recently are still in place. Key factor number one is the Federal Reserve (Fed). Based on the FOMC’s own projections at its September meeting, the policy makers foresee one more rate hike this year followed by three additional increases in 2019. If the Fed ultimately follows through on this total of four rate hikes, the top of the Fed Funds target range would be 3.25%. Using a historical analysis, the long-term average spread for the UST 2-Year note and the top of the Fed Funds target range is a little more than 30 bps. For reference, this current spread is 60 bps, but typically, as we get closer to the end of a tightening cycle, this differential does tend to narrow. So, assuming the aforementioned 3.25% level for Fed Funds plus the 30 bps long-term mean, the UST 2-Year yield could end up rising to 3.55%.
That’s one part of the equation. How about the UST 10-Year? One of the underpinnings of the recent back-up in 10-Year rates was some better-than-expected economic data. If future reports on growth and inflation do reveal further unexpectedly robust results, things could get interesting. However, in my opinion, the market would need to see more confirmation on demand pressures, especially from wages, in order for inflation expectations to spike up, boosting yield levels accordingly. According to the latest consensus forecasts, real GDP is projected to come in at +2.9% this year, a measurable improvement from the 2017 pace of +2.2%, but then moderate a bit to +2.5% in 2019. As measured by the Consumer Price Index, inflation is expected to remain somewhat flattish around the +2.5% year-over-year level, but average hourly earnings could move up from their current reading of +2.8% to +3.1% in 2019.
Conclusion
Looking at the situation from more of a bear scenario, let’s say the UST 10-Year yield breaks through the 3.25% target and heads toward 3.50%. Where does that put the UST 2s/10s curve? Based on the analysis laid out in this blog, the curve would still actually invert by 5 bps. It is also important to note that we haven’t even factored in any resumption of a “flight to quality” trade stemming from factors such as the Italian budget/credit-rating saga, emerging market woes/China growth fears, trade uncertainty and/or a sustained U.S. stock market correction, to name just a few. Bottom line: There’s still a lot of game to be played!
Disclosure: Unless otherwise stated, all data is Bloomberg as of October 12, 2018.
Disclaimer: Investors should carefully consider the investment objectives, risks, charges and expenses ...
more


