
U.S. Stocks Look Promising
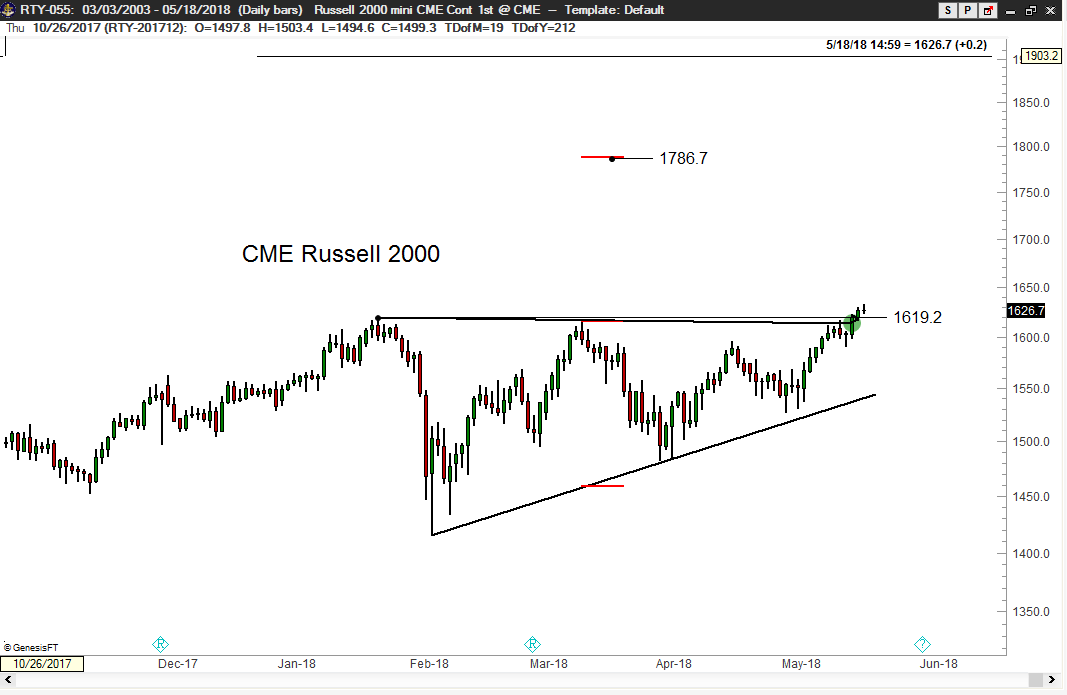
Russell 2000
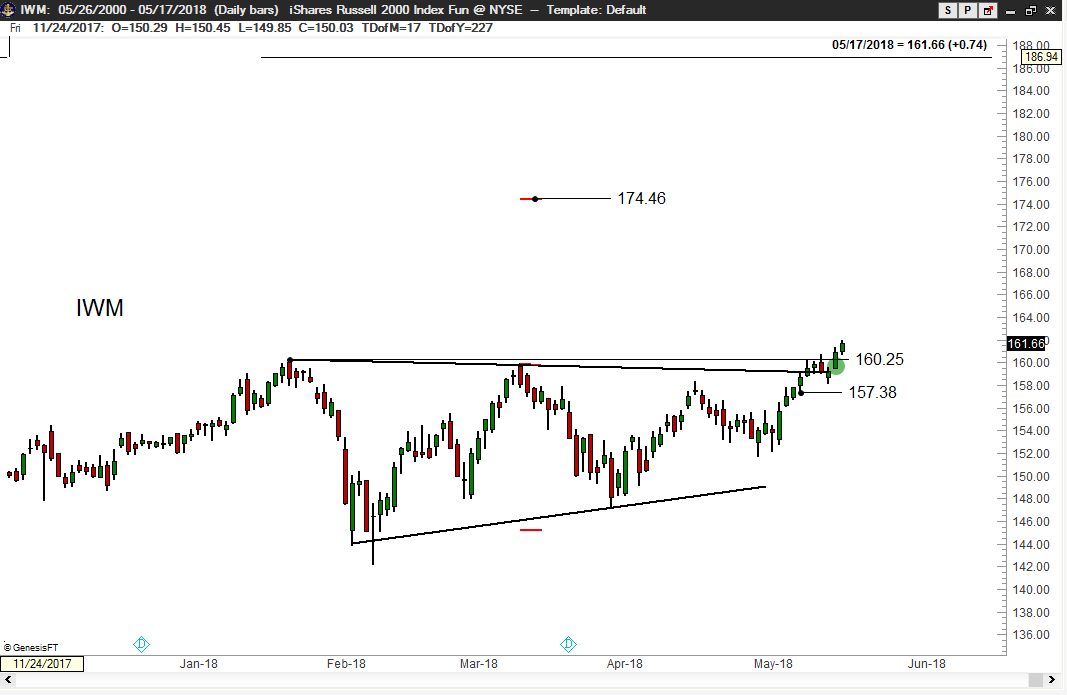
U.S Stocks look promising, with the Russell 2000 appears to be leading the upward parade. The Factor is long this market as of last Wednesday. The daily chart of the Russell 2000 ETF (IWM) is shown below after a breakout this past week that was promising.
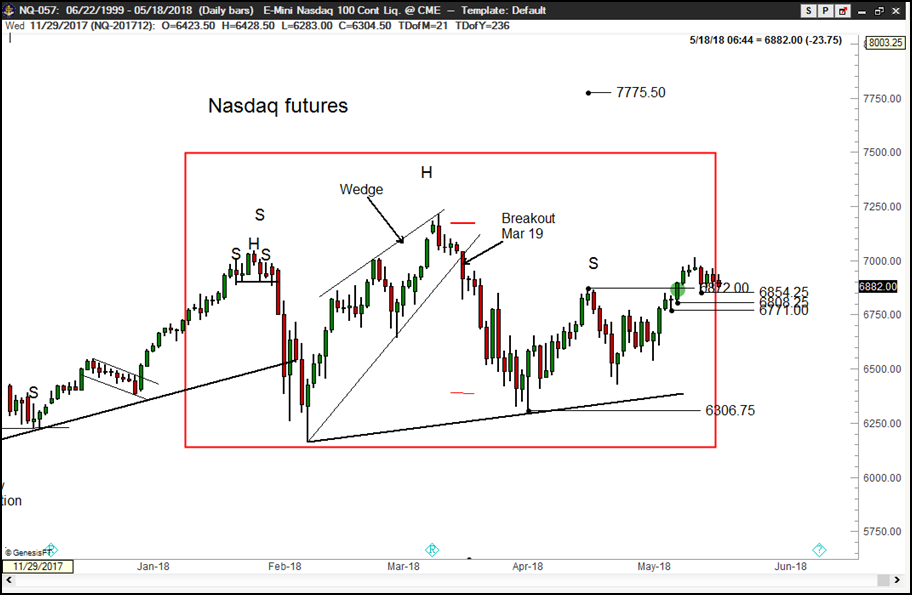
Nasdaq
A 4+ month H&S failure pattern has been completed. The upside target – if the interpretation is correct – is 7775. Factor is long the ETF (QQQ) using this past week’s low for protection.
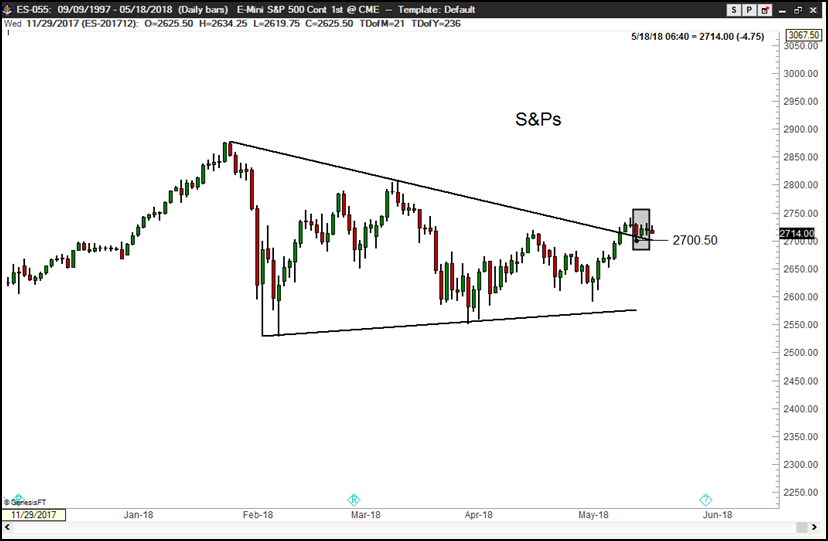
S&Ps
The daily chart of S&P futures displays a giant 16-week symmetrical triangle. The S&P chart is much weaker than the charts of the Russell or Nasdaq. For this reason, the S&Ps represent the best candidate for a short trade. The price bars on Tuesday, Wednesday and
Thursday formed a potential bearish Hikkake pattern.
[See here. Long-time friend and Factor member Dan Chesler is recognized as the father of the Hikkake pattern.] I will pay close attention to the S&Ps early next week. I will consider a short trade if a measured risk point can be identified.
Factor Membership is now available, including a quarterly option. You could consider your membership in the Factor ...
more

