
U.S. Shale Gas Industry: Countdown To Disaster
The countdown has started as the demise of the great U.S. shale gas industry has begun. This will have a disastrous impact on the U.S. economy as shale gas production declines in a big way. Unfortunately, very few Americans understand how sickly the domestic shale gas industry truly is, because they have been brainwashed to believe the United States is heading towards energy independence.
For the U.S. to become energy independent, it would have to add at least another five million barrels per day of oil production. At the peak in February 2015, the U.S. shale oil industry produced a little more than five million barrels of oil per day. However, the real problem is not the doubling of U.S. shale oil production, rather it’s being able to make a profit in the process.
The U.S. shale oil and gas industry hasn’t made any real money since 2009. This is especially true for one of the largest natural gas producers in the United States. Chesapeake Energy, which is the second largest natural gas producer in the country, hasn’t made a lousy nickel for at least the past ten years:
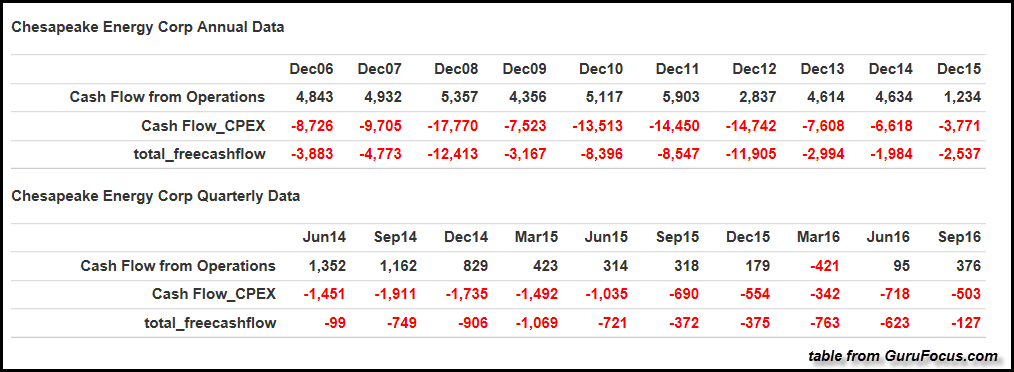
This table comes from the website, gurufocus.com. If you click on the Chesapeake Free Cash Flow link at gurufocus.com, you will see the very same table by scrolling down the page. According to gurufocus, their definition of Free Cash Flow is the following:
Free Cash Flow is considered one of the most important parameters to measure a companys earnings power by value investors because it is not subject to estimates of Depreciation, Depletion and Amortization (DDA). Over the long term, Free Cash Flow should give pretty good picture on the real earnings power of the company.
As we can see in the table above, Chesapeake Energy is completely in the RED as it pertains to free cash flow or real profits since 2006. This is quite an amazing accomplishment from the second largest natural gas producer in the country. You would think, being BIG would guarantee profits. I gather someone forgot to tell Chesapeake’s management the important financial tidbit called, “Economies of scale.”
To get an idea of the top five natural gas producers in the United States, I listed them below.
Top 5 U.S. Natural Gas Producers (Data from Natural Gas Supply Association):
[Figures shown in billion cubic feet per day]
- ExxonMobil: 3.105 Bcf/day
- Chesapeake: 2.971 Bcf/day
- Southwestern: 2.208 Bcf/day
- Anadarko: 2.164 Bcf/day
- EQT: 1.855 Bcf/day
I took the data for Chesapeake’s free cash flow and made the chart below:
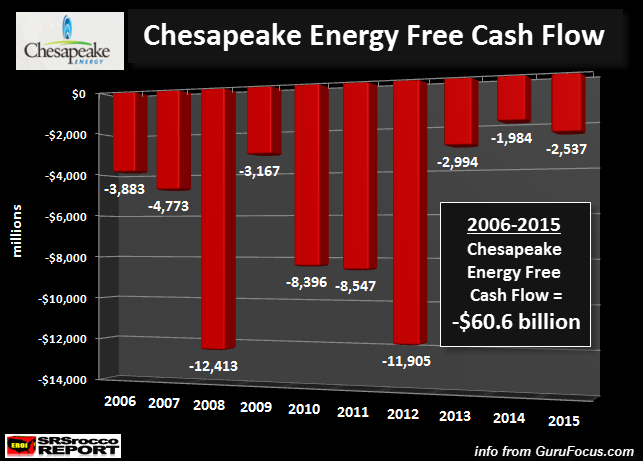
While the gurufocus.com table above is nice, this chart provides us a much clearer picture of the DISASTER taking place at Chesapeake Energy. Not only do we see a lot of RED in the chart, we can also see the total cumulative negative free cash flow for the ten-year period. Chesapeake Energy spent a whopping $60 billion more than they made from operating cash.
Basically, Chesapeake hoodwinked a lot of investors out of their hard-earned money to help make America, energy independent…. or at least they tried. Unfortunately, many of these investors still don’t realize they have been bamboozled. Why? Because a lot of Chesapeake’s debt, as well as many other shale energy companies’ debt, are bonds purchased and held by many public and private pension and retirement funds.
And… it gets even worse. I’ve read that insurance companies have invested in the Great U.S. Shale Energy Ponzi Scheme. This is quite surprising as insurance companies are supposed to invest in very safe and conservative assets. However, the ultra-low interest rates at the banks, thanks to the Clowns at the Fed, have forced investors and institutions to search for “Higher yielding” investments. While the shale oil industry hasn’t really made any money, at least they pay their bond holders a higher rate than many other investments in the market.
Regrettably, when investors or institutions try to get their initial shale energy investments back in the future, they will be for a rude awakening.
More Nails In The Chesapeake Energy Coffin
Before I continue, we must remember that Chesapeake Energy is the second largest natural gas producer in the United States. That being said, let’s look at few more troubling signs at Chesapeake.
One of the nifty ways to fund operations if cash flow isn’t adequate, is to perform STOCK DILUTION. If the company can’t make a profit, well then by God, issue more stock to a new group of poor unworthy slobs. As they say, there’s sucker born every minute.
In order to do its part in making America energy independent, Chesapeake Energy diluted its shares by 319 million, or 70% over the past decade:
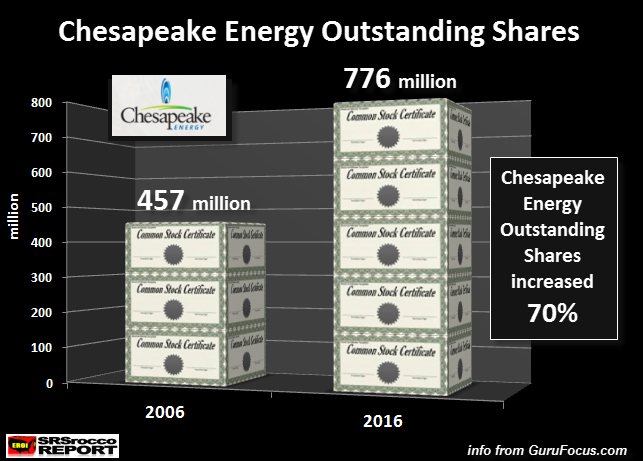
Okay, a 70% dilution of its outstanding shares over the decade wouldn’t be that bad if investors were rewarded with a decent stock price. Sadly, Chesapeake’s stock performance is just as dismal as its percentage of share dilution. Even though Chesapeake’s share price doubled since the beginning of the year, it is down 75% from its high in 2014.
Furthermore, the once mighty Chesapeake stock traded for a high of $62 in 2008, but today, trades for a mere 7 bucks a share. WARNING…For those savvy investors who are swallowing the Mainstream media hype that a new bull market in energy stocks has begun, let me show you Chesapeake Energy’s EKG… its vitals:
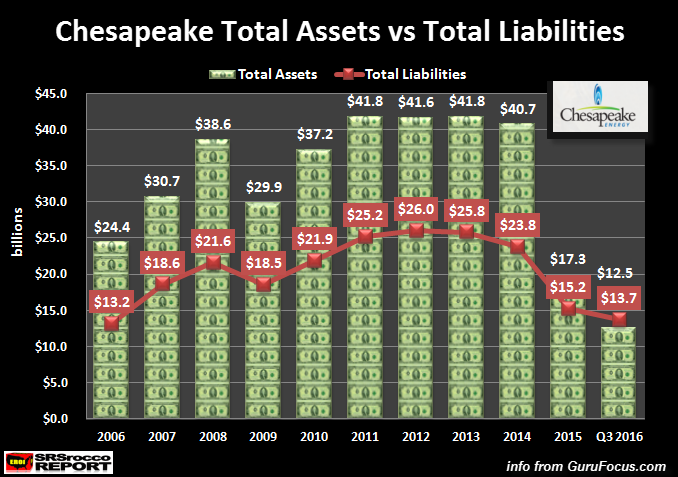
This chart should be easy for anyone to follow. The Green Dollars represent Chesapeake’s total assets and the Red Line displays its total liabilities. For a company to get a CLEAN BILL OF HEALTH, its assets must outweigh its debts… and by a wide margin.
Well, that may have been true for Chesapeake in the past, but today we see a TERMINALLY ILL PATIENT. In the third quarter of 2016, Chesapeake’s total liabilities were higher at $13.7 billion versus its total assets of $12.5 billion. Gosh, I wonder who owns the $9 billion of Chesapeake’s long-term debt?
Okay, well maybe there’s a slight chance that Chesapeake can begin to work harder at producing profits by increasing its natural gas production. To do this, they would have to spend more money. If we look at the chart below, we see another disturbing trend:
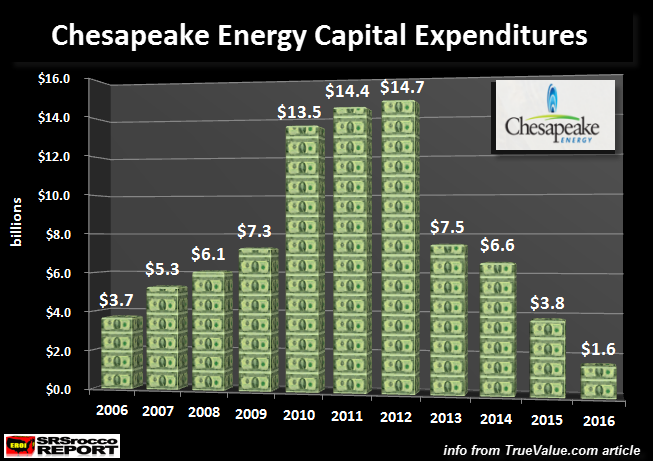
According to the figures above, Chesapeake’s capital expenditures are down a stunning 90% at $1.6 billion, since its peak of $14.7 billion in 2012. This is definitely heading in the wrong direction.
By looking at all the financial indicators, the future for Chesapeake Energy looks quite dim. Unfortunately, these indicators only provide part of the DISASTER taking place in the Good ole U.S. of A.
Chesapeake Energy Survived By Slashing Royalties To Property Owners
While Chesapeake Energy had to resort to spending $60 billion more to fund its business than it made from operations, on top of massive share dilution… this just wasn’t enough. According to several sources, Chesapeake Energy decided to slash its royalty payments to the land owners to help make American energy independent once again.
In the article, How The Fracking Industry Avoids Paying Royalties To Its Landowners, it stated:
Don Feusner ran dairy cattle on his 370-acre slice of northern Pennsylvania until he could no longer turn a profit by farming. Then, at age 60, he sold all but a few Angus and aimed for a comfortable retirement on money from drilling his land for natural gas instead.
It seemed promising. Two wells drilled on his lease hit as sweet a spot as the Marcellus shale could offer—tens of millions of cubic feet of natural gas gushed forth. Last December, he received a check for $8,506 for a month’s share of the gas.
Then one day in April, Feusner ripped open his royalty envelope to find that while his wells were still producing the same amount of gas, the gusher of cash had slowed. His eyes cascaded down the page to his monthly balance at the bottom: $1,690.
Chesapeake Energy, the company that drilled his wells, was withholding almost 90 percent of Feusner’s share of the income to cover unspecified “gathering” expenses and it wasn’t explaining why.
“They said you’re going to be a millionaire in a couple of years, but none of that has happened,” Feusner said. “I guess we’re expected to just take whatever they want to give us.”
In another article, I watched a short video on just how bad the farmers and landowners were getting screwed by Chesapeake. One farmer received $1.10 royalty one month, and then $0.10 the next. What was really shocking was that one landowner received a bill for $30,000 from Chesapeake, instead of a royalty payment. This was in the Pennsylvania Marcellus area. You have to watch this video from PA Royalty Ripoff below:
In addition, there have been several large class action royalty payment lawsuits against Chesapeake in various states in which they are producing oil and gas. Here is a map of Chesapeake’s operations:
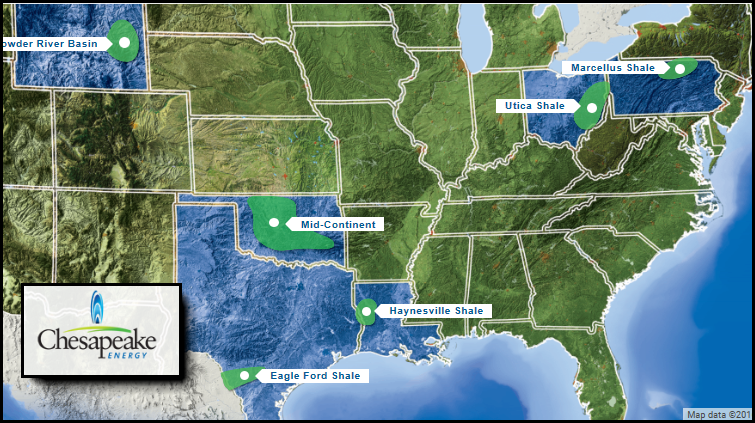
Supposedly, the Marcellus is the largest and most profitable shale gas field in the United States. Of the 43 billion cubic feet per day of U.S. shale gas production, the Marcellus is producing 18 billion cubic feet per day, or 42% of the total.
But, as several Americans in the video explain, they haven’t been receiving their royalty payments even though Chesapeake continues to extract gas. While other companies are actually paying their landowners their fair share of royalties, the situation in the entire U.S. Shale Energy Industry isn’t much better than the financial catastrophe taking place at Chesapeake.
U.S. Shale Energy Industry Has Been In The Red Since 2009
I found this wonderful table in an article, Oil Industry Spending Too Much; Deficit Spending Is Unsustainable, on the free cash flow for the Large Cap E & P oil and gas companies in the United States If there is one chart you have to see, this is the one:
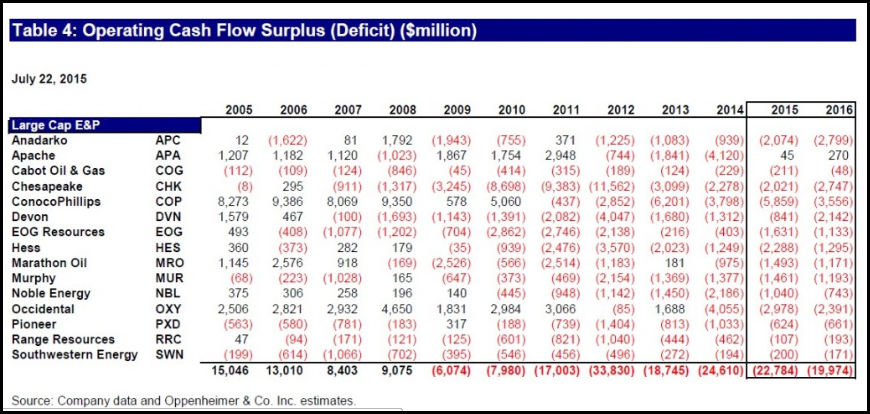
This chart gives us a true picture of the DISASTER taking place in the U.S. Shale Energy Industry. While I have focused this article on the second largest shale gas producer in the U.S., we can clearly see that the entire group lost money in 2012/2014, and the industry as a whole has been in the RED since 2009.
What is even more amazing about the figures in this table is that the Large Cap Shale Producers suffered higher losses (negative free cash flow) when the price of oil was at its highest prices from 2011 to 2014. Even though the price of oil began to fall in 2014, the average price for the year was $93.
Furthermore, the table also shows a forecast for continued negative free cash flow for the entire industry in 2015 and 2016. Thus, the U.S. Shale Energy Industry will have been in the RED for eight consecutive years.
Today, the price of oil is trading half of what it was in 2014 at $49-$50. While some analysts are pointing to “increased efficiency” and “lower production costs”, this won’t save the industry as it is still producing an INFERIOR and UNECONOMIC quality of oil and gas.
As I mentioned in my interview on the X22 Report, the amount of damage taking place on the U.S. roads and landscape by the Shale Fracking Industry is off the charts. Here is a picture from the article linked above showing the huge FOOTPRINT that one shale gas well has on a farmer’s property:
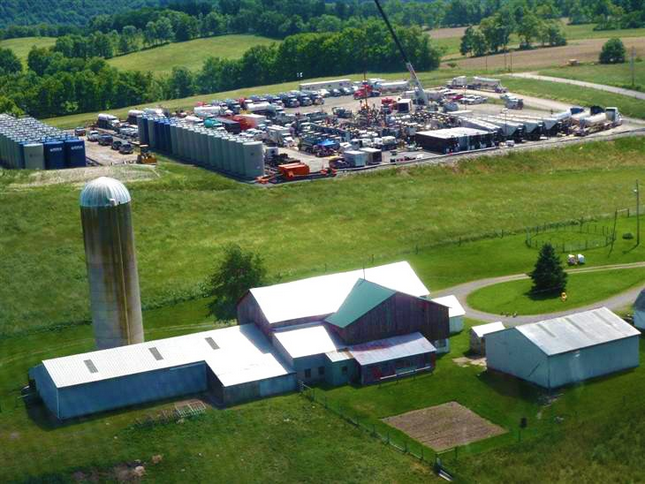
Can you imagine looking at that everyday on your picturesque farmland? What is even worse, you have to look at that when the company isn’t even paying your royalty payments. Of course, when the well is finally producing shale gas, most of this equipment will be gone, but the size of the drilling pad is huge.
Moreover, the amount of damage done to local and state roads by the Shale Fracking Industry is huge. According to the excellent research by the Energy Policy Forum,
Pennsylvania collected $204 million in impact fees in 2012 (they don’t have a severance tax), but road damage topped $3.5 billion! Since 2009, Arkansas received $182 million in gas severance taxes, but estimates road damage cost $450 million.
Well there you have it. Fracking shale gas in the Pennsylvania Marcellus generated $204 million in impact fees, but the road damage topped $3.5 billion. What a deal From the information I have read, it takes an estimated 1,600 truck trips for a single fracked well.
As we can see from all the information and data provided in this article, the Great U.S. Shale Energy Industry has been a complete failure. Moreover, we are witnessing the U.S. Shale Gas Industry, COUNTDOWN to DISASTER. When the industry finally implodes, who will pay to properly cap the tens of thousands of fracked wells?? Who will fix the roads? What happens when the natural gas-electric generation supply drops considerably?
Yes, that is correct. The United States will be in serious trouble. However, Americans today have no clue that the U.S. Shale Energy Industry has made no real money, ripped off landowners of their royalty payments, polluted groundwater and destroyed countless roads across the country, all in the effort to make us “Energy Independent.”
Well done….
Disclosure: None.


