
US Dollar Tests Two-Week Lows, EUR/USD Squeezed By ECB QE Prospects
US DOLLAR TESTS BELOW SUPPORT
The US Dollar has posed quite the short-term reversal since the visit to resistance that we looked at yesterday morning. While the Greenback was testing the topside of that confluent Fibonacci zone at the open of yesterday’s US session, prices had made a trip back down to support by the US close. After a hold of support through the Asian session, bears returned with the Euro open to push prices-lower, and this has helped to create a fresh two-week low in the US Dollar.
US DOLLAR VIA ‘DXY’ HOURLY CHART: YESTERDAY’S RESISTANCE VISIT LEADS TO TODAY’S SUPPORT TEST
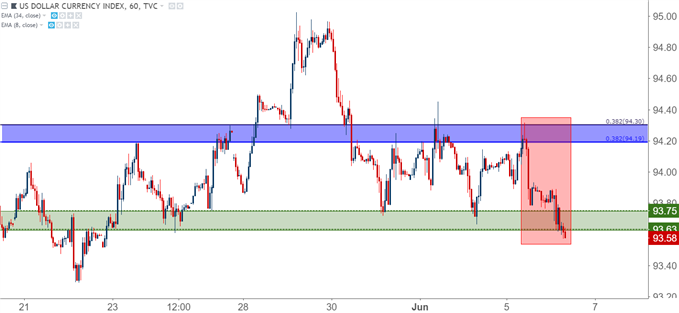
Chart prepared by James Stanley
The primary culprit appears to be a report that began to circulate yesterday afternoon in which multiple sources indicate that the European Central Bank will begin to discuss QE exit at their next rate decision set to take place next week. This seems an opportunistic move on the part of the ECB, using the recent politically-fueled downdraft in the currency to begin to roll out plans for tapering their QE program.
Earlier in the year, the prospect of stimulus exit/taper was very much the elephant in the room at ECB rate decisions. The Euro remained strong as markets were trying to get in front of what started to feel like an inevitable stimulus exit. The ECB continually deferred to talk about the topic, and this was likely driven by the fear that any actual details around stimulus exit would only serve to strengthen the currency even more. That additional strength in the Euro would only serve to make the ECB’s job even more difficult, as rising currency rates combined with rising interest rates would act as a dual compressor to inflation; and this would be the same inflation that the ECB would need to stay around 2% in order to continue normalizing policy.
We looked into this scenario in-depth yesterday as that announcement came-out less than an hour before we started. As we warned, this report helped to produce a backdrop that made the prospect of a short-squeeze in EUR/USD seem quite likely. We had previously seen four days of resistance hold in that key zone of confluent Fibonacci support. Prices made a quick return to this resistance zone shortly after that report was released, and since then prices have continued to rise to fresh near-term highs.
EUR/USD FOUR-HOUR CHART: BULLISH BREAKOUT, POTENTIAL RESISTANCE APPLIED
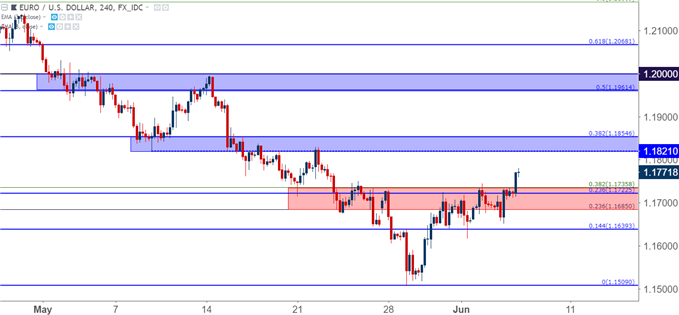
Chart prepared by James Stanley
The ECB’s next rate decision is on the economic calendar for next Thursday, and this could help bring the bid to the Euro as we approach that event. This theme in EUR/USD could have more drive to it, particularly if we end up getting an actual announcement or plan of stimulus exit. The next area of interest on the chart is a potential zone of resistance that runs from 1.1821-1.1855, and after that is another zone of resistance that runs from 1.1961-1.2000; and if we break through that area, the prospect of bullish continuation becomes an attractive theme as we’d have seen a respectable recovery from the May swoon in the single currency.
EUR/USD WEEKLY CHART: NON-COMPLETED MORNING STAR BULLISH REVERSAL PATTERN
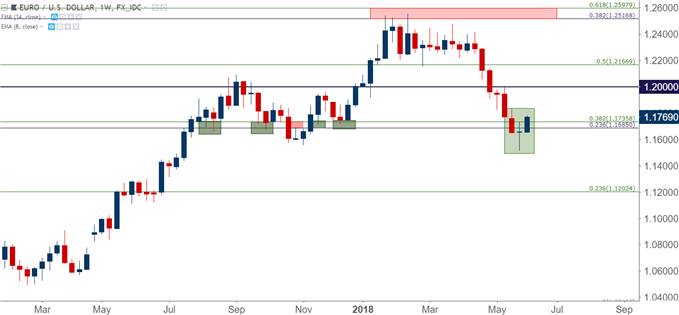
Chart prepared by James Stanley
GBP/USD REMAINS IN BEAR FLAG FORMATION
Going along with that US Dollar weakness is another bump-higher in GBP/USD. This was our long-USD setup in our FX Setups for This Week, and after an initial move down to support on Monday, prices are popping-higher and continuing to run within the bullish channel that started to build last week. As we wrote on Monday, this retains the appearance of a bear flag formation, which would indicate that this bump-higher is corrective in nature.
Now that we have USD-weakness to go along with that theme, the big question is how far GBP/USD may rise. Sitting just ahead on the chart is a key zone of prior support that runs from 1.3478-1.3500. The price of 1.3478 is the 50% retracement of the ‘Brexit move’ in the pair, and this is confluent with the 23.6% retracement of the recent sell-off. The price of 1.3500 is a psychological level that has a bit of historical importance in Cable, as this was the ‘financial collapse swing low’ that held as the low in the pair for around eight years until Brexit came along.
This could be an ideal area to look for resistance should this advance continue, and if we do take-out 1.3500 in short order, then we’re likely looking at a very bearish scenario in the US Dollar, and that’s something that may be a bit brighter in pairs such as NZD/USD or AUD/USD.
GBP/USD FOUR-HOUR CHART: TESTING CHANNEL, BEAR FLAG RESISTANCE
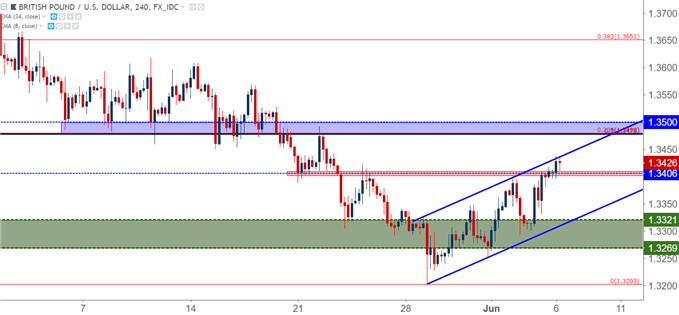
Chart prepared by James Stanley
THE YEN IS EVEN WEAKER THAN THE US DOLLAR
One currency that isn’t showing weakness against the Greenback this morning is the Japanese Yen, and this indicates a greater degree of risk tolerance in global markets as the world further takes a step back from the ledges of risk aversion. We’ve seen quite the change-of-pace in near-term price action over the past week when we were previously entertaining Euro-breakup scenarios on the prospect of a deeper political divide through the bloc, we’re now looking at the potential for stimulus exit strategies at the next ECB meeting next week.
And it would be imprudent to say that we’re ‘out of the woods.’ That situation in Italy remains fluid, and we’re nearing a weekend with a G7 meeting in which the conversation of ‘tariffs’ and ‘trade wars’ will very much be the theme du jour. But in USD/JPY, traders have taken the recent series of events in a positive manner as the pair is now back above the 110.00 psychological level.
USD/JPY FOUR-HOUR CHART: STRENGTH RETURNS ALONG WITH RISK TOLERANCE
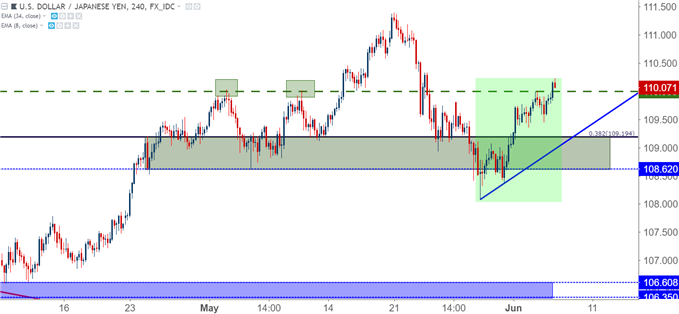
Chart prepared by James Stanley
As we looked at when Yen-strength was dominating the flow, USD/JPY may not be the most attractive pair to trade this theme. While the Japanese Yen can see significant strength or weakness on the back of risk on/off, so can the US Dollar, and this makes a pair with both of those currencies a rather lackluster venue. More enticing, however, is marrying up the Yen with a currency such as the Euro or the British Pound, which could create a bit of synergy as the risk-on impact in JPY can be coupled with further recovery in Euro or GBP.
EUR/JPY is currently up more than 400 pips from last week’s low and finding a bit of resistance at a key Fibonacci level. This opens the door for pullback possibilities, and the area of prior short-term resistance can be used to seek out higher-low support. This takes place around the 128.50-128.70 area, and the deeper swing-low around 127.80 could be used for risk placement. This would open the door to initial targets on a re-test of the 130.00 psychological level.
EUR/JPY HOURLY CHART: PULLBACK FROM FIBONACCI RESISTANCE OPENS DOOR FOR HIGHER-LOW SUPPORT
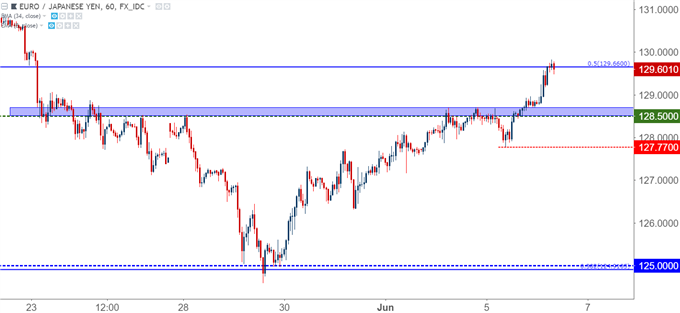
Chart prepared by James Stanley
Disclosure: Do you want to see how retail traders are currently trading the US Dollar? Check out our IG Client Sentiment ...
more

