
US Dollar Strength, Euro Weakness Remain As Risk Aversion Shows Up
US DOLLAR MAINTAINS NEAR 11-MONTH HIGHS AFTER LAST WEEK’S ECB-FUELED BURST
Last week was a big one across global markets as a number of drivers and potential new themes were unveiled. The Federal Reserve took a hawkish stance at their rate decision on Wednesday, but the immediate impact was weakness in the US Dollar as a report around increased US-Chinese tariffs began to circulate during Mr. Powell’s accompanying press conference. And then the following day saw the European Central Bank offer details on how they’re going to look to exit their massive stimulus program later in the year. They also shared that they’re expecting to keep rates at current levels ‘at least through the summer of 2019,’ and this led to a net response of a weaker Euro as markets kicked bets for rate hikes from the ECB further-out into the future. That move of Euro weakness was intense, and in short order, the currency was below the 1.1600 handle while, in a corresponding move, the US Dollar had firmed up to the 11-month high. As we open this week, that resistance remains as the US Dollar lingers near those prior highs.
US DOLLAR VIA ‘DXY’ DAILY CHART: RESISTANCE AT 11-MONTH HIGHS, SUPPORT 94.20-94.30
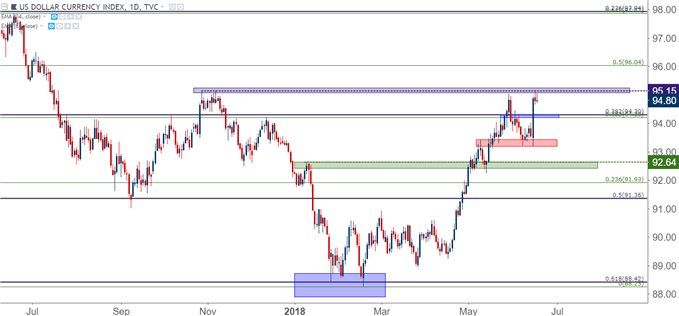
Chart prepared by James Stanley
The big question in the early portion of this week is one of motivation. Will those themes of Dollar-strength and Euro-weakness that showed so prominently in the latter portion of last week continue into this week? Mario Draghi is speaking on multiple occasions at the ECB forum in Sintra, and this will afford the ECB President multiple opportunities to clarify or define some of his prior statements, and this could continue to push the single currency as markets attempt to grapple with European rate expectations in the tail end of 2019.
On a longer-term basis, the swing-low from a couple of weeks ago looms ominously on the chart; and there’s the potential for lower-high resistance in a key zone should a deeper bounce build-in as we open this week. That area runs from 1.1685-1.1736, and this has been support or resistance multiple times over the past year. This area had shown as resistance after that brutal sell-off in the pair in May, soon becoming support as we walked into ECB. Prices broke-down around last week’s meeting, cutting directly through this area as sellers grasped control. If we do get a bounce into this zone, the door opens for bearish strategies, looking for lower-high resistance ahead of a print to fresh lows.
EUR/USD DAILY CHART: LOWER-HIGH RESISTANCE POTENTIAL IN KEY ZONE 1.1685-1.1736
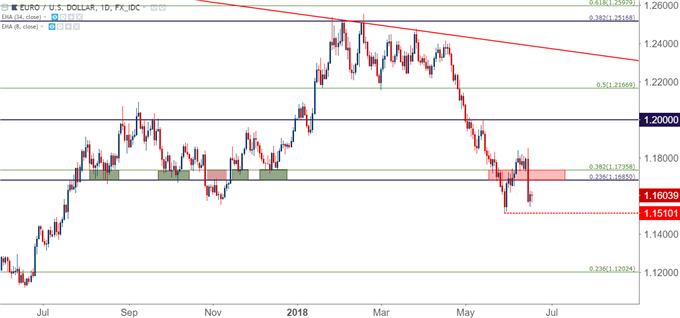
Chart prepared by James Stanley
THIS WEEK’S ECONOMIC CALENDAR
The ECB conference in Sintra is the highlight for the first few days of this week, but matters pick up on Thursday with rate decisions out of the Bank of England and the Swiss National Bank. No actual rate moves are expected at either meeting, but the details here are what’s important. At the Bank of England, the item of interest is whether the bank lays the groundwork for a possible move in August at their next Super Thursday rate decision; and in Switzerland, inflation just hit its highest level since 2011, printing at one-percent in the month of May.
DailyFX Economic Calendar: High-Impact Events, Week of June 18, 2018
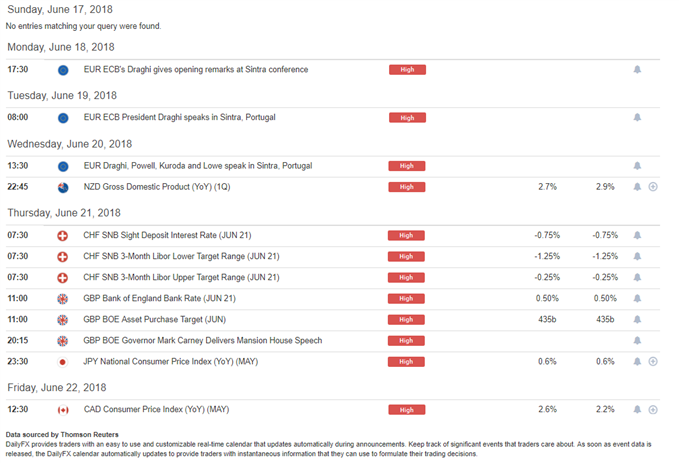
Chart prepared by James Stanley
RISK AVERSION POTENTIAL IN EQUITIES
One of the more noticeable themes emanating from the one-two combo of last week’s FOMC and ECB meetings has been an uptick in risk aversion. The Dow Jones Industrial Average was bucking-up against a key area of resistance as we went into the Fed rate decision, and prices promptly began to turn-lower as the FOMC brought a hawkish tone to markets. Thursday saw a Doji build in the Dow as the ECB remained loose and passive, but Friday saw more selling, and so far futures markets are indicating more of the same as we open into a fresh week.
We had looked at a short-side setup in the Dow last Tuesday, and that theme has continued to show. On Friday, we published an update, looking for some element of support around the prior zone of support around 24,500.
DOW JONES DAILY CHART: TURNING FROM 14.4% FIBONACCI RETRACEMENT (POST-ELECTION MOVE)
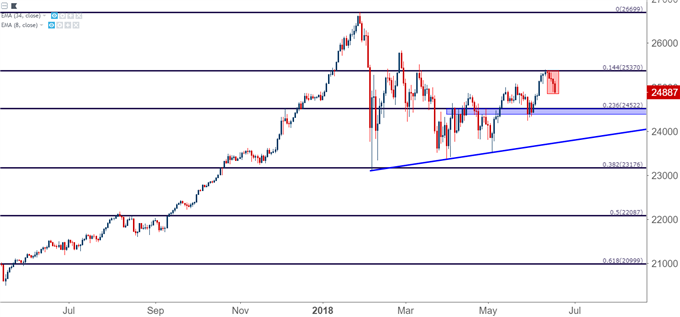
Chart prepared by James Stanley
RISK AVERSION IN FX-LAND: LOOK TO THE YEN
In our FX setups for this week, we looked at a currency pair that could be attractive should this theme of risk aversion continue to build. We had focused in on GBP/JPY for that purpose, looking to focus-in on Yen strength along with what could be an amenable counterpart in the British Pound, all while looking to avoid the Euro as the single currency has its own themes getting priced-in. Prices in GBP/JPY were finding resistance at a key level to close last week, and this opened the door for short-side stances, targeting a re-test of the 145.00 level that had turned prices around in March, followed by the May swing at 143.20 on the way to fresh lows.
GBP/JPY DAILY CHART: BEARISH CONTINUATION POTENTIAL IN RISK AVERSION SCENARIOS
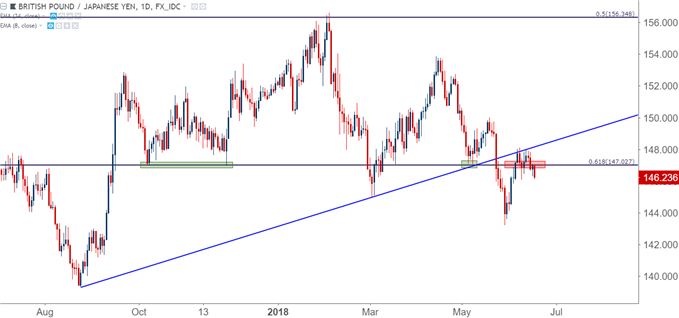
Chart prepared by James Stanley
Disclosure: Do you want to see how retail traders are currently trading the US Dollar? Check out our IG Client Sentiment ...
more

