Thursday, February 15, 2018 9:38 AM EDT
In recent days, a good deal of focus has been on the US Dollar's attempt to climb out of its downtrend. However, given growing fiscal concerns and evidence of a regime change in markets, we've cautioned that it's still too early to call a bottom in the greenback. More evidence has emerged that the US Dollar may still have weakness ahead.
Ignoring the fundamentals for the moment - which have clearly turned against the buck - the technical picture for the DXY Index, as well as several USD-pairs, remains rather bearish.
Price Chart 1: DXY, AUD/USD, EUR/USD, & GBP/USD Daily Timeframe (2018 YTD)
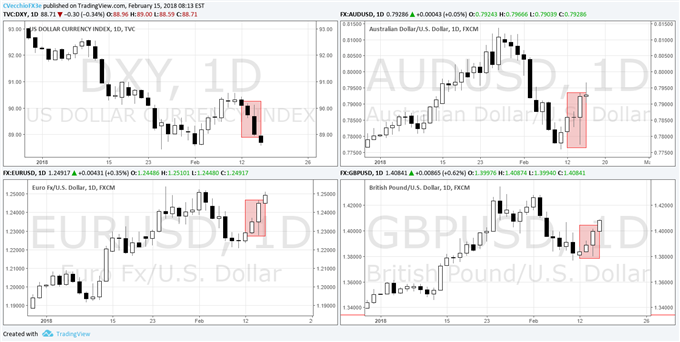
For the DXY Index, price is now back below its daily 8-, 13-, and 21-EMAs. Daily MACD and Slow Stochastics have started to pinch and turn lower. A reading of the candlesticks from yesterday likewise reveals signs USD-bearish momentum is picking up:
- Bearish outside piercing bar: DXY, USD/CHF, and USD/JPY
- Bearish outside engulfing bar: USD/CAD
- Bullish outside engulfing bar: AUD/USD, EUR/USD, GBP/USD, NZD/USD
These candles offer clear, defined levels of risk for traders. Ultimately, however, the key level traders need to watch out for in the DXY Index before a sincere bottom can be called is thus 91.01. The DXY Index put in its 2017 bottom at 91.01 on September 8, and since breaking through said level on January 12, price hasn't looked back. Yesterday's price action does little to suggest that the bottom is coming anytime soon.
In an environment where volatility has picked up, it is absolutely imperative that traders adjust their risk management perspective.
Disclosure: DailyFX, the free news and research website of leading forex and CFD broker FXCM, delivers up-to-date analysis of the ...
more
Disclosure: DailyFX, the free news and research website of leading forex and CFD broker FXCM, delivers up-to-date analysis of the fundamental and technical influences driving the currency and commodity markets. With nine internationally-based analysts publishing over 30 articles and producing 5 video news updates daily, DailyFX offers in-depth coverage of price action, predictions of likely market moves, and exhaustive interpretations of salient economic and political developments. DailyFX is also home to one of the most powerful economic calendars available on the web, complete with advanced sorting capabilities, detailed descriptions of upcoming events on the economic docket, and projections of how economic report data will impact the markets. Combined with the free charts and live rate updates featured on DailyFX, the DailyFX economic calendar is an invaluable resource for traders who heavily rely on the news for their trading strategies. Additionally, DailyFX serves as a portal to one the most vibrant online discussion forums in the forex trading community. Avoiding market noise and the irrelevant personal commentary that plague many forex blogs and forums, the DailyFX Forum has established a reputation as being a place where real traders go to talk about serious trading.
Any opinions, news, research, analyses, prices, or other information contained on dailyfx.com are provided as general market commentary, and does not constitute investment advice. Dailyfx will not accept liability for any loss or damage, including without limitation to, any loss of profit, which may arise directly or indirectly from use of or reliance on such information.
** All times listed in GMT. See the full DailyFX economic calendar here.
less
How did you like this article? Let us know so we can better customize your reading experience.


