
US Dollar Pullback Continues; Can The Dow Break Its Losing Streak?
DOW DOWN EVERY DAY SINCE FOMC, CAN BUYERS BREAK THE LOSING STREAK?
The Dow Jones Industrial Average has sold-off now every day since the Fed’s rate hike last week. As we came into last week’s rate decision, US equities were fresh off the heels of bullish breakouts in April and May that held strong into early-June trade. But as FOMC neared, the Dow found resistance at the 14.4% Fibonacci retracement of the post-Election move, and after the FOMC and ECB outlays last week, selling pressure pushed prices-lower and that theme has largely continued ever since. Sellers have remained in control throughout this week, and as we move towards this week’s close the Dow Jones Industrial Average is testing a big zone of potential support. This may be the type of catalyst that the index needs to break that negative streak.
DOW JONES DAILY CHART: TESTING KEY SUPPORT ZONE 24,384-24,522
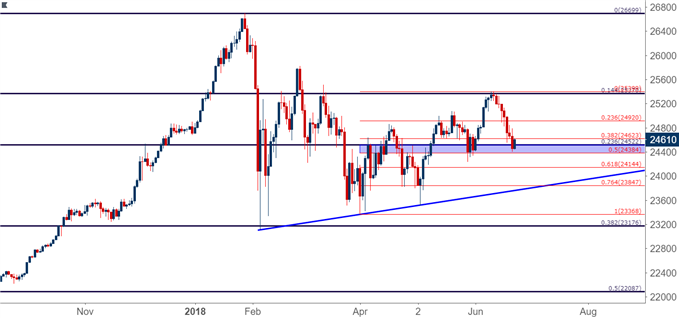
Chart prepared by James Stanley
NEXT WEEK’S ECONOMIC CALENDAR
Next week’s economic calendar has multiple high-impact items, with a few reports out of Europe that could be especially interesting. German CPI is due on Thursday, and this is followed by Euro-Zone CPI and German unemployment numbers on Friday. The Reserve Bank of New Zealand hosts a rate decision on Wednesday afternoon, and high-impact US data accents the calendar Tuesday-Friday.
DAILYFX ECONOMIC CALENDAR: HIGH-IMPACT EVENTS FOR THE WEEK OF JUNE 25, 2018
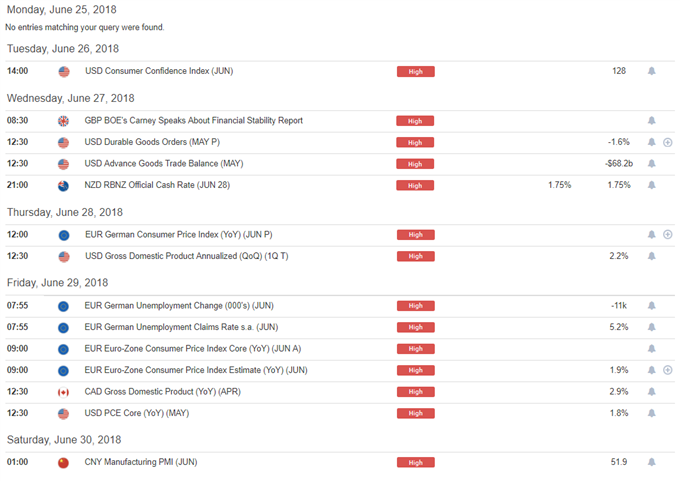
Chart prepared by James Stanley
US DOLLAR APPROACHING KEY SUPPORT ZONE
The pullback in the US Dollar has continued, and prices are now trading near fresh weekly lows. While the Greenback held on to that theme of strength into the open of yesterday’s trade, a retracement began to show yesterday morning around the release of the Philadelphia Fed manufacturing index, and that theme has largely continued ever since. This may not be the trend-turning type of allure that bears might be looking for, but it does have the potential to help the US Dollar get down to an area of higher-low support, and that could open the door for bullish continuation strategies.
The area of 94.20-94.30 is especially interesting for this scenario. The price of 94.30 is the 38.2% retracement of the 2014-2017 major move, and 94.20 is the 38.2% Fibonacci retracement of the 2017-2018 down-trend. This zone helped to elicit resistance when prices were on their way up but, as of yet, hasn’t shown much for support. If we can get a deeper pullback, buyers showing up in this area could make the prospect of bullish continuation a bit more attractive.
US DOLLAR VIA ‘DXY’ FOUR-HOUR CHART: APPROACHING POTENTIAL SUPPORT/PRIOR RESISTANCE
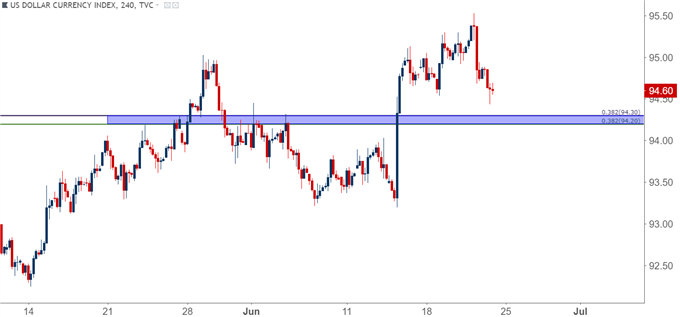
Chart prepared by James Stanley
EUR/USD – EURO DATA IN FOCUS ON THURSDAY, FRIDAY
With rate hike bets around Europe being cast further out into the future, the risk would be to the upside here as positive beats of data could bring a slightly more bullish drive into the pair. This would be similar to what happened last October when the ECB extended stimulus into 2018. EUR/USD initially dropped below a big support zone, but just a couple of weeks later a red-hot German GDP report brought bulls back into the fray. In short order, we were back to fresh multi-year highs as EUR/USD was challenging the 1.2500 level.
In EUR/USD, we’d earlier remarked this week that the setup appeared to be a bear trap; and this showed yesterday as prices made a failed attempt to take out the low at 1.1510. Prices are now moving back towards a key zone of potential resistance that runs from 1.1685-1.1736, and if we do see some element of resistance begin to show here, the door could open for a deeper bearish move that may actually be able to take out the 1.1500 psychological level.
EUR/USD DAILY CHART: MOVING BACK TO KEY ZONE 1.1685-1.1736
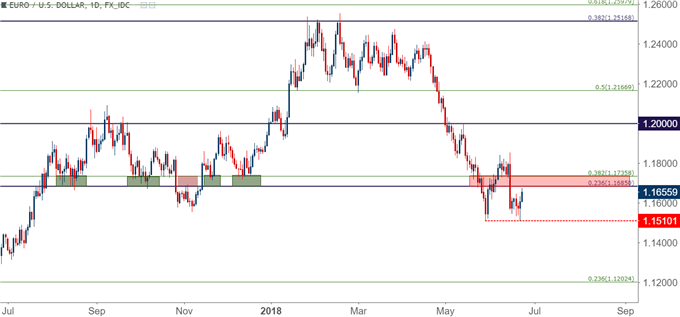
Chart prepared by James Stanley
GBP/USD CONTINUES BOUNCE AFTER YESTERDAY’S BOE
Yesterday’s Bank of England rate decision was a bit surprising as three members of the MPC voted for an immediate rate hike, and the fact that the BoE’s Chief Economist was one of the dissenters certainly seemed to catch notice. GBP/USD had earlier in the day run-into the 38.2% retracement of the Brexit move at 1.3117. This was an initial target in a short-side setup we’d looked at earlier in the week; but after the results of that vote circulated through markets, Sterling bulls began to take control. At this stage, we’re now testing the 1.3300 level, but there may be more upside here before longer-term bears may be motivated enough to jump into the trade.
The zone of potential resistance that runs from 1.3447-1.3500 could be especially interesting for this theme, as this area had held support for almost three weeks in May, even through the dovish BoE ‘Super Thursday’ rate decision in the early portion of the month.
GBP/USD FOUR-HOUR CHART: DEEPER RESISTANCE POTENTIAL 1.3447-1.3500
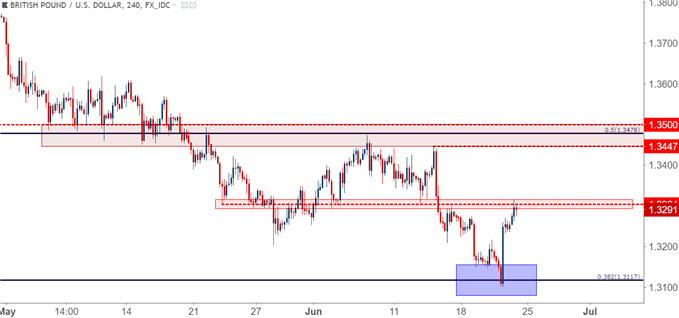
Chart prepared by James Stanley
USD/CAD CATCHES A BID AFTER DISAPPOINTING CANADIAN INFLATION
Canadian CPI numbers were released this morning to a considerable disappointment. The expectation was for a print of 2.6% and the actual release came out at 2.2%. This further hit odds for a near-term rate hike out of the BoC and the Canadian Dollar has continued its descent in the aftermath of the report. This helped to bring in a quick test of a key Fibonacci level on the USD/CAD price chart, as this shows at around 1.3385, which is the 76.4% retracement of the May-September, 2017 sell-off.
USD/CAD DAILY CHART
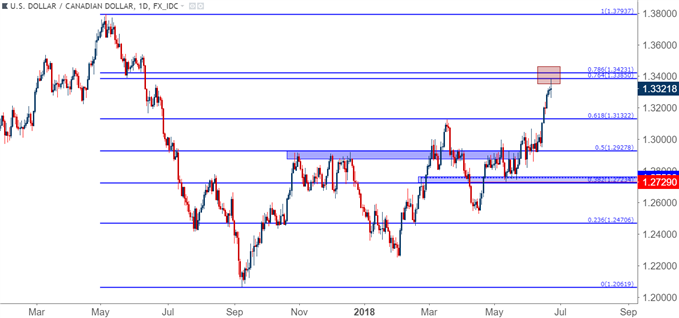
Chart prepared by James Stanley
Disclosure: Do you want to see how retail traders are currently trading the US Dollar? Check out our IG Client Sentiment ...
more

