
US Dollar Index Now Approaching Key Levels On Weekly Chart
Ahead of Friday’s advance GDP for the US markets, its time to take a longer term look at the US dollar index from a technical perspective based on the weekly chart, as the index once again approaches some key resistance levels.
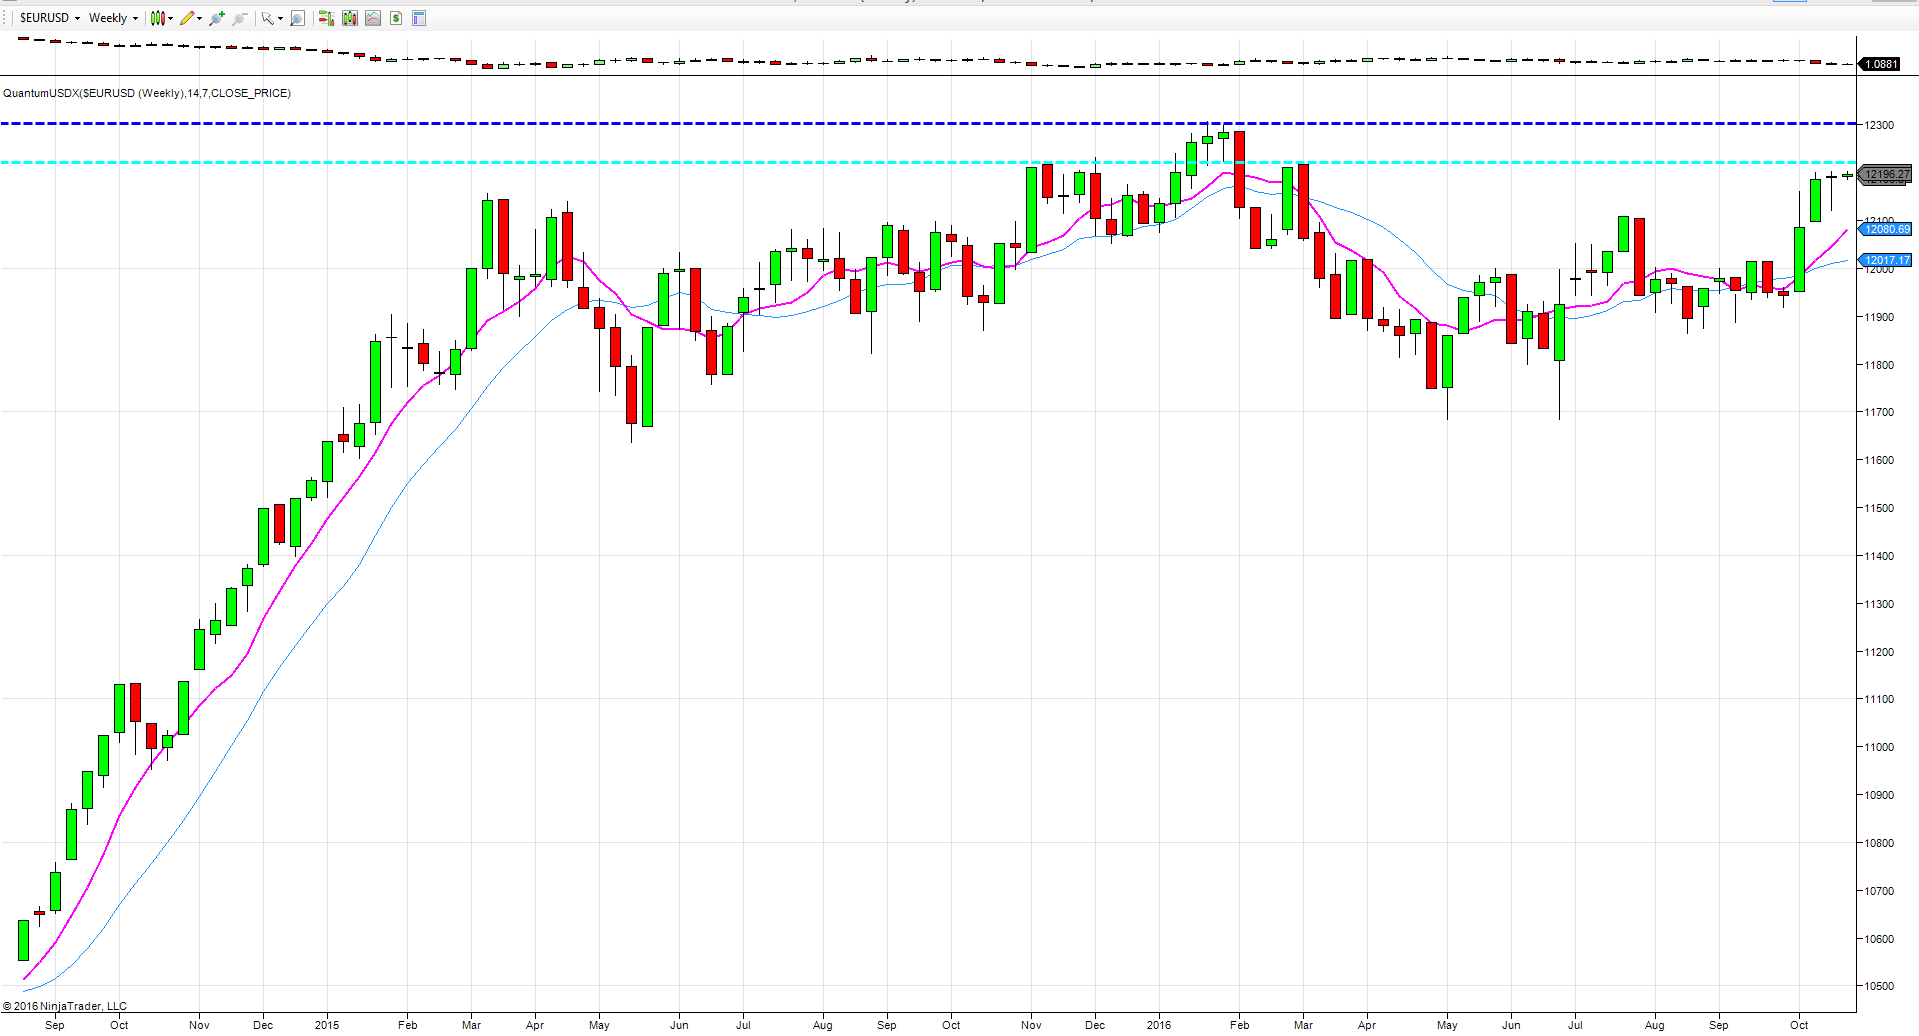
In the last few weeks, the US dollar has finally found some traction following the malaise of the summer months which saw the index test the 11,700 area on two occasions, before moving higher to consolidate in the 11,900 to 21,100 region during August and September. Price action in October finally injected some momentum, propelling the dollar index through the 12,100 and on higher to currently trade at 12,199 at the time of writing as we now approach the first key resistance area, denoted with the light blue dotted line at 12210. This was level that presented a stiff barrier to progress higher for the index back in late 2015 and early 2016, and from which developed the second area of resistance in late January denoted with the dark blue dashed line in the 12,300 area.
What is perhaps most revealing is the extent and depth of the current congestion phase for the index, which has been contained for eighteen months, with the floor of support firmly in place in the 11,700 region and the ceiling now in sight once again. Much of course will depend on the fundamental drivers for the USD, including the US election. But against the political background, we also have the GDP data on Friday, followed by the next Fed meeting in November as the sands of time ebb ever faster for a rate hike with December once again now looking more likely. And if the FED due deliver a rate hike, this may be the catalyst for the breach of these two key resistance levels which now await in the 12,200 and 12,300 areas. If these are finally taken out, the bullish trend for the US dollar will then continue with a very strong platform of support firly in place.
For the DXY it is a similar picture with the two key levels being those at 99.75 and a higher level at 100.60, and should the dollar index turn 100 once again, then this too will signal further bullish momentum for the dollar, and adding to the bullish picture for the DXY is the increase in net speculative longs at the CFTC which last Friday stood 60,566 contracts, up over 26k since the beginning of October.
Disclaimer: Futures, stocks, and spot currency trading have large potential rewards, but also large potential risk. You must be aware of the risks and be willing to accept them in order to invest in ...
more

