
US Dollar Drives To 11-Month Highs As Stocks Continue To Sell-Off
RISK AVERSION CONTINUES ACROSS GLOBAL MARKETS
The Euro got a bump-lower in the overnight session and EUR/USD is closing in on that prior 11-month low that was set a couple of weeks ago. This move hasn’t been in isolation, as we’ve also seen a continuation of risk aversion as global equities have deepened the sell-off that started to show around last week’s FOMC/ECB rate decisions.
As we approach the US equity open, both Dow and S&P Futures are trading near interesting areas of potential support. In the Dow Jones, we looked at a short-side setup last week, plotting resistance off of the 14.4% retracement of the post-Election move. That sell-off has continued, and prices are now approaching the 23.6% marker of that same move. If we do see some support build-in around this area, with respect to the prior group of swing-lows set in late-May, the door could reopen for bullish strategies. If buyers can’t hold the line, however, it looks as though a trend-line re-test may be in short order.
DOW JONES DAILY CHART: SELL-OFF DEEPENS TO 23.6% FIBONACCI RETRACEMENT
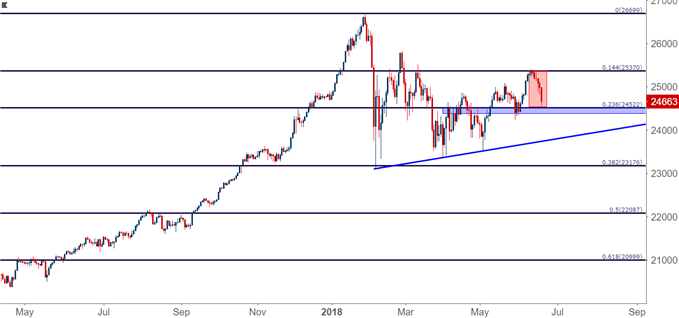
Chart prepared by James Stanley
The S&P 500 is also testing support, and this comes in from a couple of different areas. The price of 2744 is the 61.8% Fibonacci retracement of the February sell-off, and this area had helped to set resistance in mid-May as the index was pegged within a range. S&P futures dipped below this level in the overnight but, thus far, buyers have pushed prices back above.
S&P 500 DAILY CHART: TESTING FIBONACCI SUPPORT, PRIOR RESISTANCE
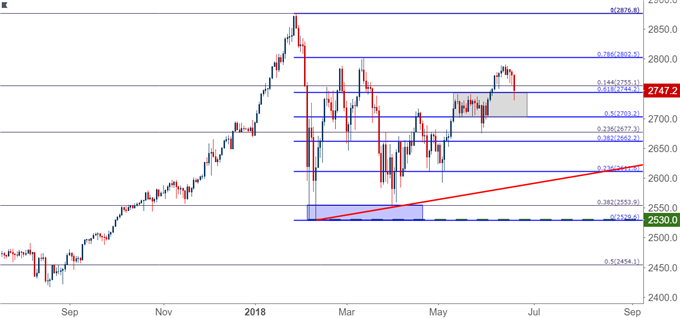
Chart prepared by James Stanley
US Dollar Drives Up to Fresh 11-Month High
Going along with that move of risk aversion has been an extension in the US Dollar’s bullish run. DXY is now trading at fresh 11-month highs after finally breaking above the prior September swing of 95.15. The next levels of interest on DXY are at 96.04, which is the 50% retracement of the 2017-2018 down-trend, followed by 96.50, which was a prior swing low/high. If we break above 96.50, which was the July, 2017 high – then we’ll have fresh one-year highs in the US Dollar.
US DOLLAR VIA ‘DXY’ DAILY CHART: BULLISH BREAKOUT TO FRESH 11-MONTH HIGHS
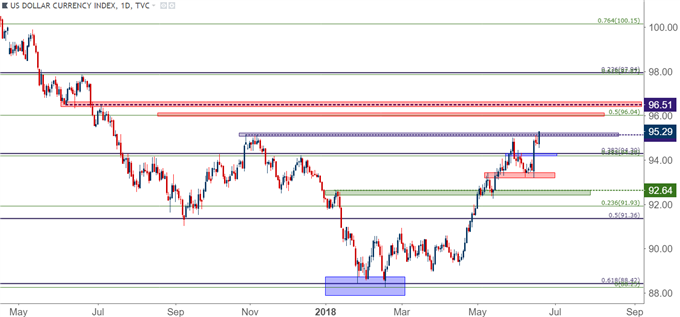
Chart prepared by James Stanley
EUR/USD CLOSING IN ON 11-MONTH LOWS
In a move related to what we looked at above in the US Dollar, EUR/USD is slaloming down towards the swing-low that was set in late-May. Prices had bounced just before a test of the 1.1500 psychological level, but if we break-through on a recurrent approach, the door is opened for deeper losses, perhaps as deep as the 1.1200 area on the charts. On a longer-term basis, we can see prices trading through a bullish trend-line that can be found by connecting the early-2017 swing lows in the pair. This trend-line projection had helped to catch the lows in late-May, but it appears as though that was a fleeting theme as prices soon reverted back to bearish and continued to drive-lower.
EUR/USD WEEKLY CHART: TESTING TREND-LINE/WEDGE SUPPORT
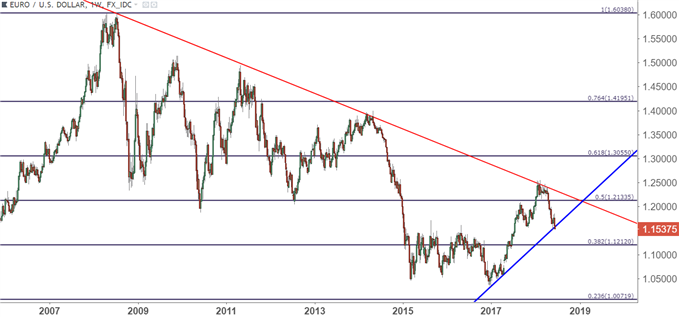
Chart prepared by James Stanley
RISK AVERSION IN THE FX MARKET BRINGS YEN STRENGTH
This move of risk aversion has not been isolated to equities, as the FX market has shown hues of the risk off theme as well. In this week’s FX setups, we looked for this to play out in GBP/JPY, and the pair has already quickly moved to the initial target. This can keep the door open for a deeper bearish move as the pair is fast approaching its eight-month low around 143.20. This can also open up the potential for a series of deeper short-side targets, starting with that 143.20 spot and moving-lower to 142.50, 141.25 followed by the psychological level at 140.00.
GBP/JPY DAILY CHART: APPROACHING EIGHT-MONTH LOW AROUND 143.20
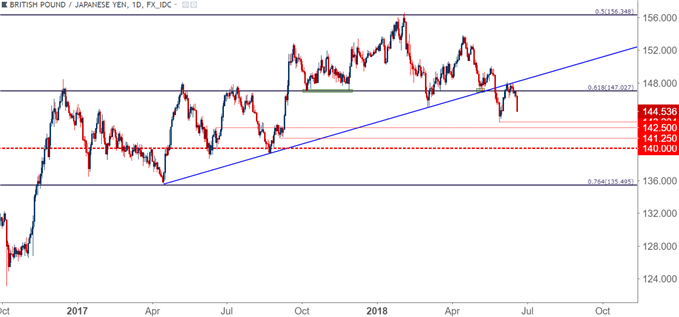
Chart prepared by James Stanley
THIS WEEK’S FX CALENDAR
As we looked at yesterday, this week’s FX calendar is rather back-loaded, with two high-impact rate decisions on the docket for Thursday of this week. The Bank of England hosts a rate decision early on Thursday morning, and while there’s little hope for any actual moves, the growing anticipation is whether or not the bank signals a possible rate hike in August at their next ‘Super Thursday’ rate decision. Given the scope of inflation, and also taking into account the continued saga around Brexit negotiations, and there appears to be little positivity in the currency at the moment.
We looked into this yesterday in our technical piece on GBP/USD, showing how the currency was attempting to carve-out support. But, as we shared, there was little bullish innuendo here, and rather than looking at support for reversal plays, we looked at bearish breakouts on prints to fresh lows. That happened in the overnight, and now the big question is how deep this move might run. Next potential supports are at 1.3117, followed by the psychological level at 1.3000.
GBP/USD DAILY CHART: CONTINUATION AFTER BREAK OF BEAR FLAG, POTENTIAL TOWARDS 1.3000
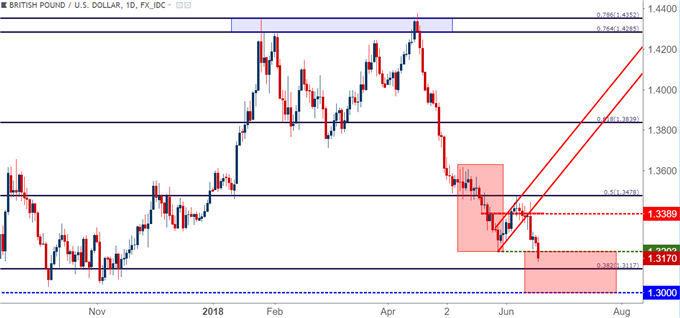
Chart prepared by James Stanley
Disclosure: Do you want to see how retail traders are currently trading the US Dollar? Check out our IG Client Sentiment ...
more


Margin calls could undo Trump. He is talking tariffs on $450 billion of Chinese products with equal retaliation.