
Update On The US Dollar Index From A Geometric Perspective
Short-Term/Daily:
- Dollar should move higher off solid geometric support
Intermediate-Term/Weekly:
- Watch for possible bullish reversal around current geometric support.
- Upside target of 97.874 following bullish confirmation.
SHORT-TERM VIEW:
The dollar recently broke out of circular daily resistance, but is now getting geometrically cornered:
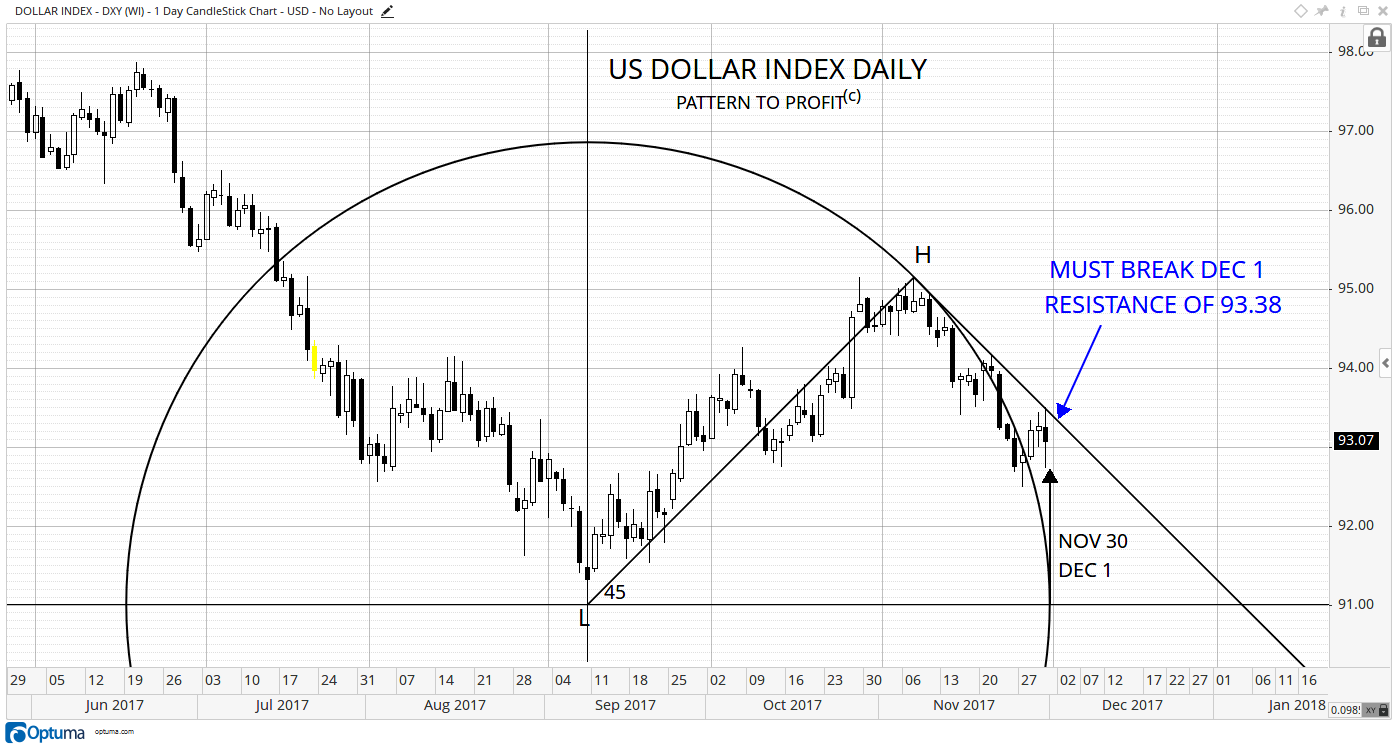
- Dollar must break descending trendline resistance to signal a move higher and a continuation of the circle breakout from earlier this week.
- Resistance of the line for Friday, December 1st is at 93.38.
- Timing point of both Nov. 30/Dec. 1 is dictated by the circle point (black arrow) at the center low level of 91.01.
The current market also demonstrates strong support around current price levels as well, which can be seen in this next chart:
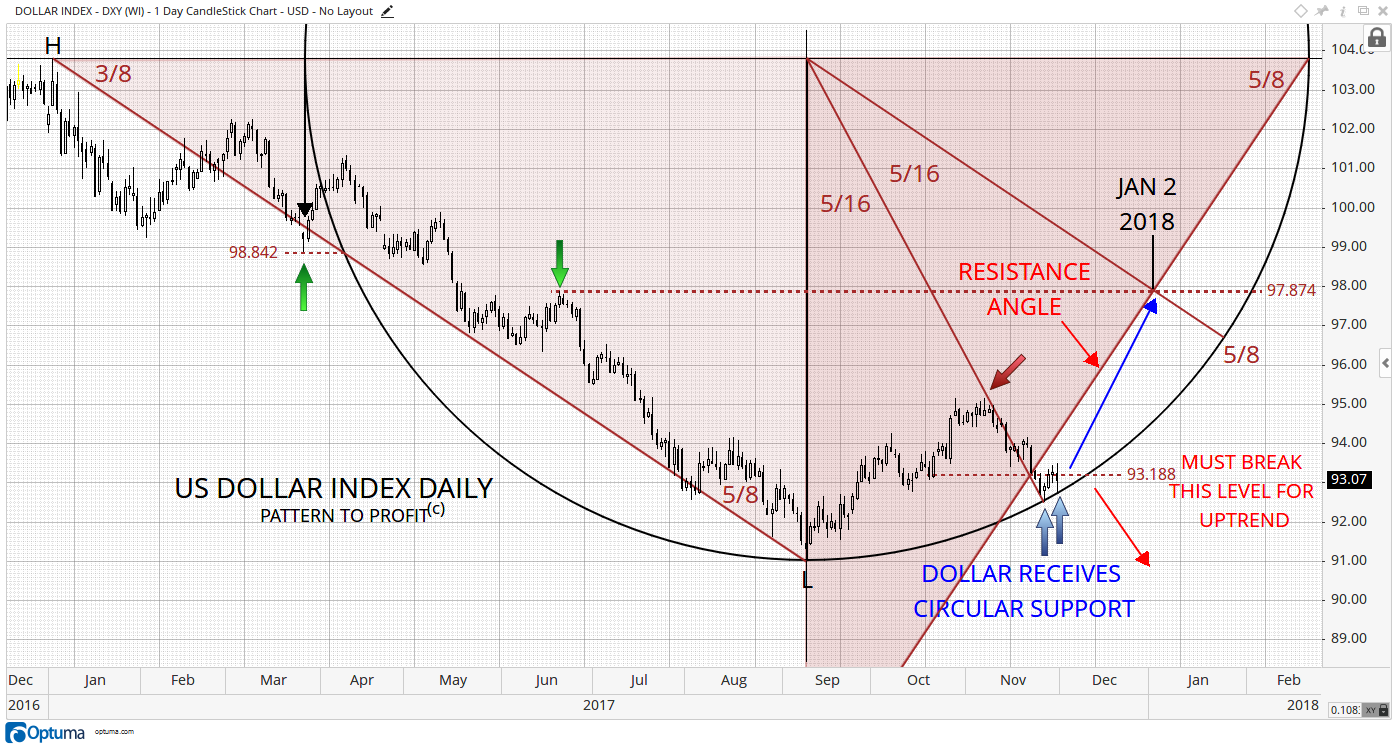
- If the dollar maintains daily closing prices above the displayed resistance of 93.188 with higher highs, then there is a strong chance that not only will the market crossover resistance of 93.38 (from the previous chart), but the uptrend will continue to the next marked resistance of 97.874.
- Timing point of Jan 2, 2018, are identified at resistance of 97.874, and is certainly a realistic target.
- Several reversals prior to the major low are related to this geometry (green arrows), which strengthens the analysis and targets (retrospective confirmation).
- Alternatively, any break of circular support with lower lows is a strong indication of a continued downtrend.
INTERMEDIATE-TERM PERSPECTIVE:
The dollar is forming a higher swing low at related geometric support for the potential major low of September 8, 2017:
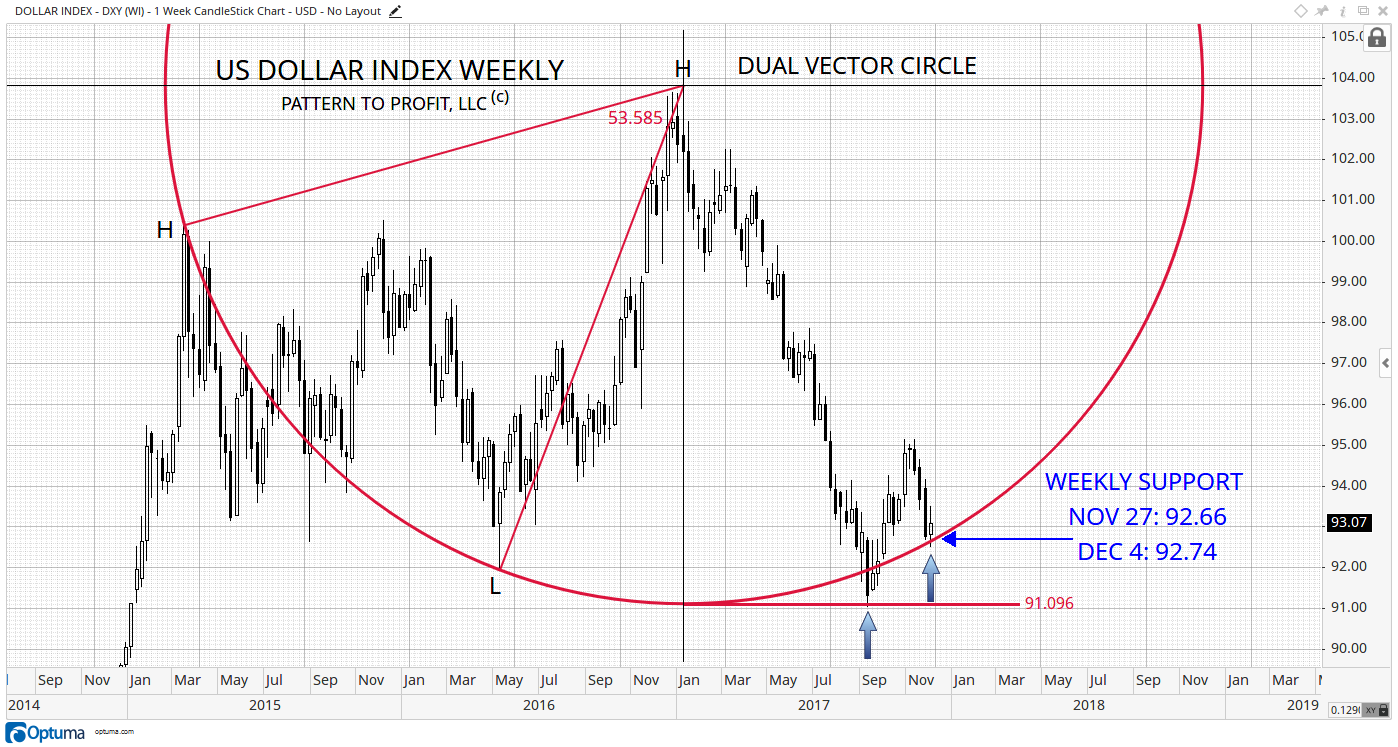
- Support for Friday, December 1 is at 92.66.
- The week of December 4 sees circular support of 92.74.
- If support holds followed by higher highs, the market is expected to trend higher.
- A break below circular support signals an end to the uptrend. (Upside targets to be provided in the upcoming Weekly Report for the week of December 4th)
- If circular support is broken to the downside, the circle bottom price of 91.096 is the next support level, offering a hopeful double-bottom with the preceding low if it occurs.
- Further, if 91.096 is taken out, then a major downtrend (long-term) is expected down to the previous major lows of 2012-2014 in the 79.00 area.
Disclaimer: /we have no positions in any securities mentioned, and no plans to initiate any positions within the next 72 hours.
How did you like this article? Let us know so we can better customize your reading experience.

Comments
Leave a comment to automatically be entered into
our contest to win a free Echo Show.

