
Understanding The “Elevated Risk” Concept
I have been saying for some time now that the stock market is not a low risk proposition at this stage of the game. There are several reasons for taking this stance, but Exhibit A in this argument is the state of stock market valuations. So, this morning, I’d like to review some hard, cold data on the subject – in order to make sure that we are all “seeing” this picture clearly.
The first point on this fine Wednesday morning is that, on an absolute basis, stocks are extremely overvalued. And since a picture is often worth/better than 1,000 words, below are four charts that make this case clear.
The first is the Price-to-Earnings ratio for the NYSE Composite using the median stock to do the calculation. This chart goes back to 1980.
(Click on image to enlarge)
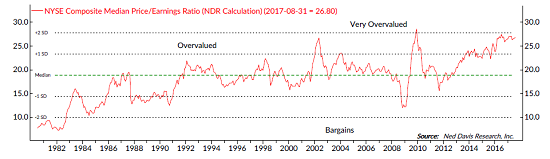
As you can see, the median stock on the NYSE is currently valued at one of the highest levels seen in the last 37 years.
Next up is the Price-to-Sales ratio for the S&P 500…
(Click on image to enlarge)
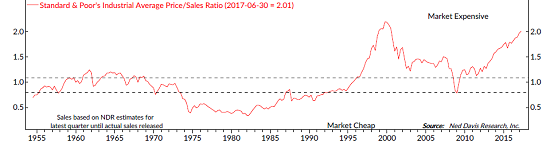
I’m not sure there is much more that needs to be said here as the only time stocks were more overvalued since 1955 was during the technology bubble period.
Now let’s turn to the Price-to-Cash Flow Ratio…
(Click on image to enlarge)

This appears to be the same story. With the exception of the tech bubble, stocks have never been more overvalued when compared to the cash generated by the companies that make up the S&P 500.
And finally, let’s look at the median P/E for the S&P 500…
(Click on image to enlarge)
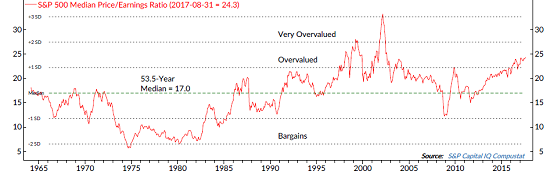
While this chart is not as dramatic as the last two, the point is that with the exception of the tech bubble period, valuations have never been higher.
However, nowadays, there are lots of different ways to look at valuation. In fact, Ned Davis Research has 20 different metrics that can be used to quantify the state of market valuations.
Cutting to the chase, currently 16 out of the 20 metrics say stocks are “extremely overvalued.”
NDR then split up the valuation levels into quintiles and took a look at how the market reacted in the ensuing 10-year period. As you might suspect, the best 10-year annualized returns (+15.7%/year) come after stocks were very undervalued, while the worst (-6.5%/year) occurred after very overvalued markets.
So, from my seat, it is hard to argue that valuations are not a problem. And for this reason alone I contend that the risk of a market mishap is elevated. In other words, the level of valuations means that if something bad were to happen, the ensuing decline in stocks would likely be more severe than normal.
But to be clear, this does NOT mean that one should sell everything and head to the sidelines. First and foremost, we must understand that this type of environment can last for years and that the bears usually need some sort of catalyst or trigger to turn the game around. So, with the economy and earnings growing at a decent clip, inflation nowhere to be found, and the Fed trying their darndest not to upset the apple cart, the current valuation picture is just part of the game.
On The Other Hand
I know that people hate it when I do this, but since the stock market game is NEVER black and white, it is important to be able to look at all sides of a position. Thus, it is critical to recognize that on a “relative” basis – meaning when compared to the level of interest rates – valuations are actually quite reasonable.
The bottom line is there isn’t much competition for the stock market in the global financial system. I.E. Where else is the money going to go with rates so low?
It is likely for this reason that money continues to find its way into the U.S. stock market and that all the dips continue to be bought with enthusiasm (the most recent dip in August and the ensuing run to fresh all-time highs is a perfect example). So, until the rate situation or the fundamental backdrop changes, it is a safe bet that this game is likely to continue.
About Those FAANG’s…
Another big worry the bears like to talk about is the leadership of the so-called FAANGs (Facebook, Apple, Amazon.com, Netflix, Google, etc.). The thinking is that since these big-cap leaders are really where the action is in this market, these stocks must be REALLY expensive – and, in turn, very high risk.
So, next time, we will take a look at valuation levels of the “Q’s” and see if this is true…
Thought For The Day:
Life is not about waiting for the storm to pass, it is about learning to dance in the rain. – Unknown
Current Market Drivers
We strive to identify the driving forces behind the market action on a daily basis. The thinking is that if we can understand why stocks are doing what they are doing on a short-term basis; we are not likely to be surprised/blind-sided by a big move. Listed below are what we believe to be the driving forces of the current market (Listed in order of importance).
1. The State of the Tax Reform
2. The State of the Economic/Earnings Growth (Fast enough to justify valuations?)
3. The State of Geopolitics
4. The State of Fed Policy
Disclosure: At the time of publication, Mr. Moenning and/or Sowell Management Services held long positions in the following securities mentioned: none. Note that positions may change at any ...
more

