
Two-Sided Markets Return, Look For More Action This Week
Summary:
• The S&P 500 moved lower last week, declining by 5.1%.
• Market participants continued to express concern about the impact of rising inflation on economic growth.
• Our projection this week is for stocks to bounce and then resume their decline into the cycle bottom.
SPX Chart (Daily Bars)
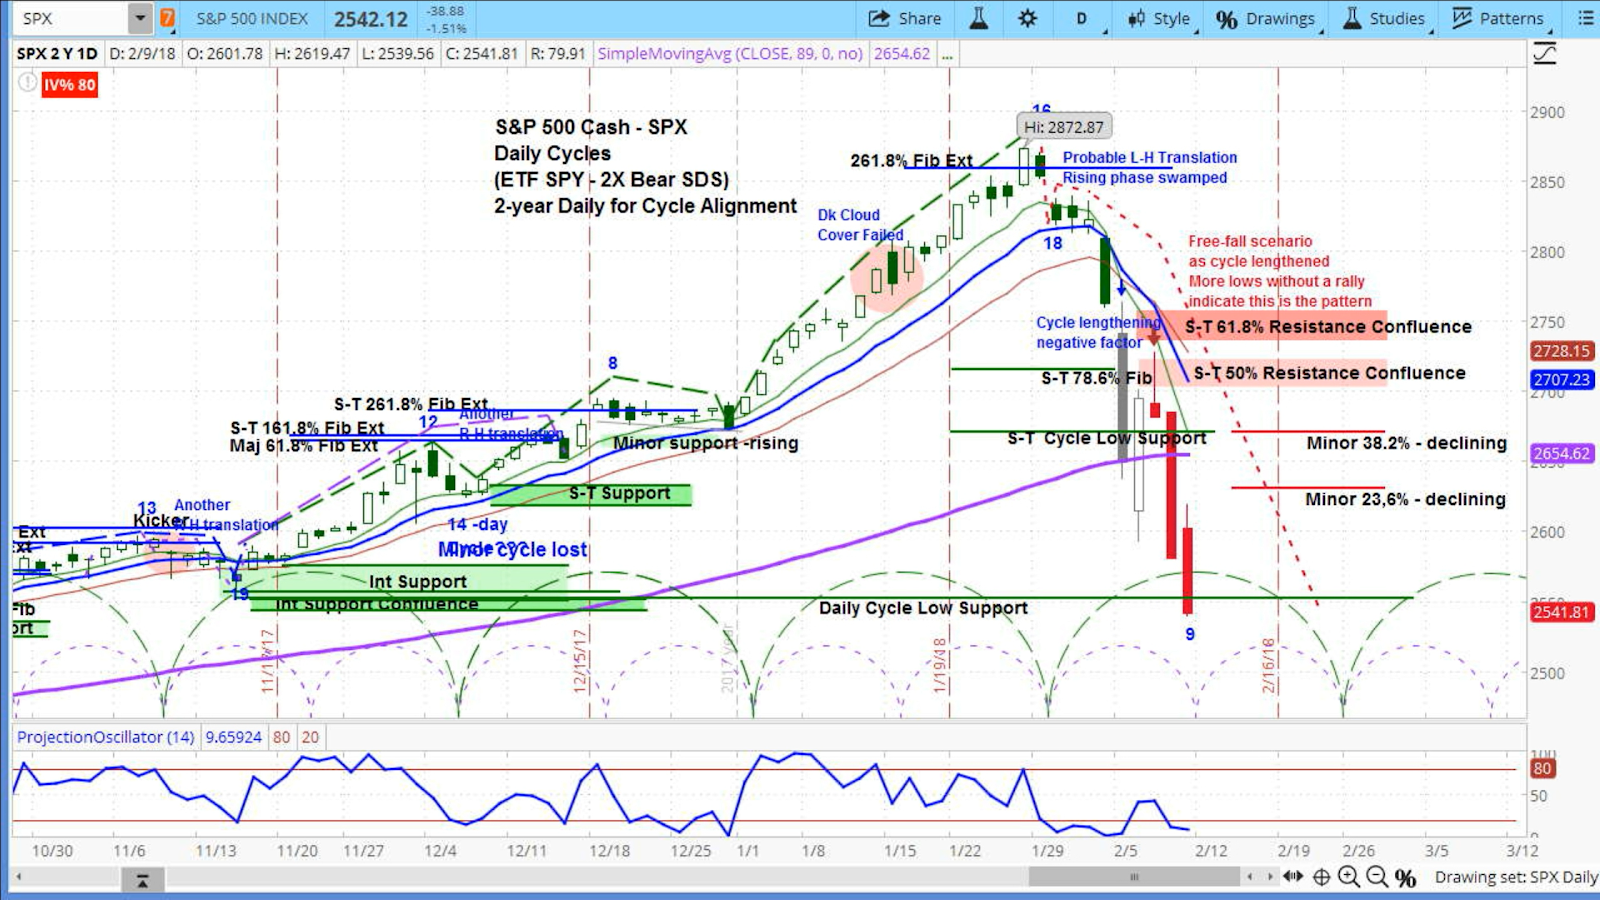
The stock market got crushed last week, with the S&P 500 (SPX) down 142 points to 2619. On Monday, the market initially pushed higher, following the previous down week. But when the rally failed, stocks fell hard, with the SPX was down 114 points on the day, or 4.1%.
This selling pressure was related to fears about inflation. This began with a report of rising wages from the Department of Labor on the previous Friday. Also, yields on 10-year US Treasury notes were approaching 2.9%. This was likely taken in the context of concerns that the Fed and other central banks will continue to withdraw stimulus from the last financial crisis.
This only brings us to the close of Monday’s trading session. The full-throated selling lasted into the close, and then continued after hours.
At this time, the “short volatility” trade came into focus, as volatility had risen dramatically, from 17 to 50. This move crippled market participants who had wagered on a continuation of low volatility. After the close, the S&P 500 futures sank another 78 points, from 2607 to 2529.
On the next two days, the market mostly bounced. But a weak auction in 10-year notes on Wednesday led to another rise in yields, again approaching 2.9%. This sparked more inflation concerns, which led to a move lower in equities for most of the remainder of the week.
The daily chart above shows our projection for the S&P 500 (SPX) in the coming week: a bounce higher in equities, and then a resumption of the move lower into the cycle bottom, as the declining phase of the current market cycle completes.
We made this call in our Market Week video below on Friday, which was announced to our members at 1:30 PM Chicago time. The bounce began later in that session.
The green-dotted semicircles at the bottom of the chart represent the market cycles.
Disclaimer: So many commentators talk about a stock market crash, bust or boom just to make it exciting. Slim looks at things very differently, applying his unique cycle analysis to nearly 400 widely ...
more

