
Twitter Caught In "Fibs"
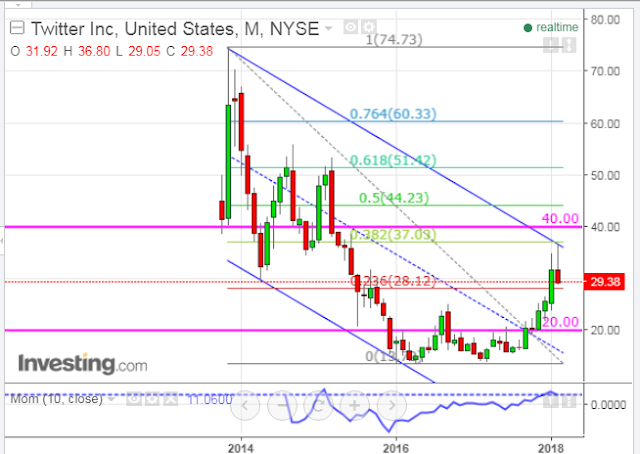
Twitter (TWTR) is stuck in between two long-term Fibonacci retracement levels (after nearly tagging and retreating from the 40% Fib) and a downtrending channel, as shown on the following monthly chart.
Momentum had been building since mid-2017, but was capped in mid-February.
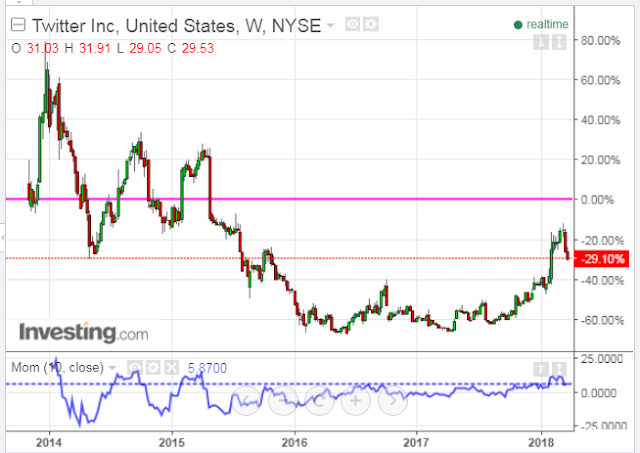
It is 29% lower than it was at the close of its first week of its IPO (November 7, 2013), as shown on the weekly chart below.
A drop and hold below 28.00 could see a further decline to 20.00, or lower. Alternatively, a break and hold above 40.00 would be needed to confirm a sustainable price rally.
(Click on image to enlarge)
(Click on image to enlarge)
How did you like this article? Let us know so we can better customize your reading experience.

Comments
Leave a comment to automatically be entered into
our contest to win a free Echo Show.

