
Tweaking My REIT Yield-Hog Screen For Better “Distribution Quality”
In a 7/5/18 blog post, I introduced a Real Estate Investment Trust (REIT) yield-hog screen. Obviously, it seeks high yields. Less obviously but more important, it first carefully prequalifies the candidates by eliminating REITs I deem most vulnerable to outsized distribution cuts by considering REIT cash on cash return and leverage. But upon using the screen in practice, I discovered a hitch which I address here through a revision.

The Recipe
Most of the model is exactly as it originally stood. Hence most of the details presented here are reproduced verbatim from my 7/5/18 post. To spare you the burden of re-reading everything, I conspicuously identify which items are new.
- I start by eliminating a sub-group known as mortgage REITs. I want genuine real estate operations, not wannabe-but-less-regulated banks. The data I use doesn’t work for them and I’m not confident in my ability to evaluate the kinds of risks they present.
- Next, I try to weed out dividend problems that have already surfaced. I ban REITs that have eliminated the dividend in any of the last four quarters. In a perfect world where we could always count on dividend achievers, dividend aristocrats, etc., I’d also expel REITs that have reduced, but not completely eliminated, the dividend in any of the past four quarters. But if I’m going to focus on business factors, I have to cope with the reality that sometimes, things get choppy. As pass-through entities, REITs don’t have as much leeway to pay out much smaller portions of earnings; a practice corporations use to smooth things when they hit some turbulence. Hence even good, worthwhile, REITs are going to reduce payouts every now and then. I’m trying to reduce the likelihood this will happen in the future while I hold the shares, but if I wag my finger every time it happened in the past, I’ll wind up eliminating far too many meritorious operations. So I’ll tolerate reductions in dividend over the past four quarters, so long as the drop wasn’t so severe as to be the functional equivalent to an elimination.
- The next test may come as a surprise considering the expressed ideal of aiming at the top of the high-to-low yield sort: No REIT makes it into the sorting if its yield is in the top 10% relative to the REIT group. As noted, Mr. Market is remarkably good at recognizing the most dangerous income plays and signaling the world by pricing the securities such as to push yields up to the stratosphere.
- NEW: I add another test to eliminate any REIT for which items other than ordinary income (capital gain-related items or returns of capital) accounted for more than 25% of the latest annual distribution.
- REVISED: I look next at COC return and limit consideration to REITs that rank well when the numbers are calculated for the trailing 12 months and also over the past three years. Initially, this meant returns that ranked above the 50th percentile in the trailing 12 months and in terms of the three-year average. I maintain that threshold for the three-year figure, but I relax the trailing 12-month rank to allow inclusion if the COC return is above the 40th percentile (i.e. the top 60%). This reflects a balance between stringency and inclusiveness. The pickier a model is with its numeric rules, the smaller the number of passing stocks will be. Since I reduced the already not-so-big result set by the introduction of the above-mentioned rule relating to the components of the last annual distribution, I felt a need t relax something else to make up for what would otherwise have been a shrunken list of passing REITs. This is consistent with the tolerance I already exhibited in the rule relating to dividend cuts, where I accept that we will experience off years and that with REITs being pass-through entities, shareholders will be closer to the periodic zigs and zags. There is no hard and fast rule that says a REIT in the 40-50 percentile range is materially worse than one at 50. Because investors always point toward the unknowable future, we can never escape the need to approximate and this strikes me as a reasonable approximation, especially since the three-year average cutoff remains as is at 50.
- Finally, I address (debt) leverage; I won’t invest in a REIT with a debt-to-equity ratio above 2, which by Real estate standards, is conservative.
- From among passing REITs, select the five that have the highest yields
- I refresh the screen and reconstitute the portfolio, as needed, to equal weighting, every four weeks.
Rationale For The Change
The change on which we should focus on is the one involving the composition of the distribution. The COC return tweak flows directly from that.
REIT distributions look and feel like dividends, at first. But they really aren’t. Dividends are normally paid form income; that’s so for corporations and it’s so for REITs. But REIT “distributions” (the word is often used interchangeably with “dividends,” which, although not strictly accurate, is definitely convenient) can include other things besides “ordinary income.” They can and do typically include capital gains and Unrecaptured Section1250 (a tax thing related to property sales the details of which can easily be Googled if you’re really into it), as well as return of capital.
Capital gains distributions (and related section 1250 distributions) are part of a REIT’s normal business but less predictable and often less stable than income. So although capital gain and section 1250 distributions are perfectly fine, given my druthers, I’d rather see a bigger portion of my distribution coming from something more stable, like ordinary income.
The bigger problem I have is with returns of capital. Mutual funds fund this by taking money out of the portfolio. REITs do this by drawing on “depreciation,” which is perfectly fine because real estate doesn’t actually depreciate so this non-cash accounting fiction can be freely disseminated to outside shareholders as part of the distribution. Well, that’s the theory. I suspect we might hear otherwise if we asked people professionally involved in building upkeep. I spent a decade as a director and officer of an approximately-200 unit New York City co-op and although we booked depreciation, we weren’t at all cavalier about what we did with the cash equivalent. And if you really want an earful on how real assets supposedly don’t depreciate ask a New York City subway rider or anyone stuck in traffic as seemingly perpetual construction crews lose two out of three lanes, four out of five, or whatever, or any property manager cursing the weekly charges for those ugly sidewalk bridges under which pedestrians often have to walk. This is actually part of a topic for another day bit for now, suffice it to say I’m not interested in any REIT for which an unusually large (by REIT standards) portion of its distribution is return on capital.
What’s dicey here is that sources that published yields typically use information from quarterly dividend releases, so they have no way of knowing whether or to what extent the distributions come from income, gains, or returns of capital. — until the REITs release their Tax Treatment of Distributions documents usually in January of the next year.
So how big a problem is this?
Well, from an immediate-term shareholder tax perspective, it might actually be pretty darn good. Capital gains are taxed lower than ordinary income and returns, of capital are not taxed at all on day one. You can ignore returns of capital you get this year when you fill out your returns for the 2018 tax year. They’ll catch up to you eventually when you sell; returns of capital lower your cost basis and lead to larger capital gains or smaller capital losses — assuming you or your accountant keeps accurate records or that the IRS catches you if you don’t
My issue with non-income sources of distribution are is analogous to the what we refer to under the heading “earning quality,” the thing that scares the daylights out of investors. Earnings quality, strictly speaking, is not about ethics or fraud. (That’s a whole different thing.) It's about aggressive accounting practices that companies lawfully use to make reported earning look higher than they would if the CFO graduated at or near the bottom of their class and didn’t master all the fancy techniques. The problem with these aggressive accounting techniques is sustainability in the future. The greater the use of aggressive accounting, the less “persistent” earnings tend to be because the data we use for analysis is filled with more things we can’t count on to recur down the road. Earnings quality research is all grounded in this notion; the notion of persistence; see, for example, Scott A. Richardson, Richard G. Sloan, Mark T. Soliman and Irem Tuna, Accrual Reliability, earnings persistence and stock prices, 39 Journal of Accounting & Economics 437-85 (2005).
As an income investor, I’m interested in dividend persistence. As earnings quality analysts disdain things they believe are associated with lesser earnings persistence. When investing for income, disdain things I believe are associated with lesser dividend persistence. I have not seen any serious research on this topic yet, but my hypothesis is that while capital gains and returns of capital are part of the REIT landscape, unusually high levels of either or both are not, and that unusually high non-income components of distributions are predictors of lesser dividend persistence. I may turn out to be the one that researches the topic to the point of generating a serious paper. Meanwhile, as an investor, I may and do choose to act on my hypothesis immediately since I believe it comports with common sense.
In the revised version of my screen, I chose 75% as a threshold level I want to see for ordinary income as a percent of the distribution. There’s no science to this. It’s based on my ad hoc examination of tax documents for REITs to get a sense of what’s normal and what’s not, and supported by this from NAREIT, the main REIT trade association: “On average, 76 percent of the annual dividends paid by REITs qualify as ordinary taxable income, 10 percent qualify as return of capital and 14 percent qualify as long-term capital gains.”
Testing the Revised Screen
I wasn’t expecting much on this front. In the 7/5/18 blog post that introduced the initial screen, I was candid about the fact that backtesting stunk but that I would go ahead with the screen anyway. I said then and still believe that real estate is an area in which we must be especially attuned to the boilerplate notion that past performance does not assure future outcomes. In real estate, past performance was heavily influenced by a climate in which interest rates plunged dramatically, meaning real estate players could and often did count on Uncle Fed to shield them from the consequences of carelessness or recklessness but that going forward, with the next interest-rate mega-trend locked into being sideways (best case scenario) or upward, the old environment under which backtesting was done is dead and gone. We’re at the beginning of a new generational paradigm in which money in real estate will have to be made the old fashioned way, by being good at it. I won’t count on test run using data from the old paradigm to guide me in the new one.
With that said, I present here Table 1, which shows the results of rolling tests through which a set of portfolios was formed each week and run for four weeks. It compares the results of the original version of the screen with the revised version.
Table 1
(Click on image to enlarge)
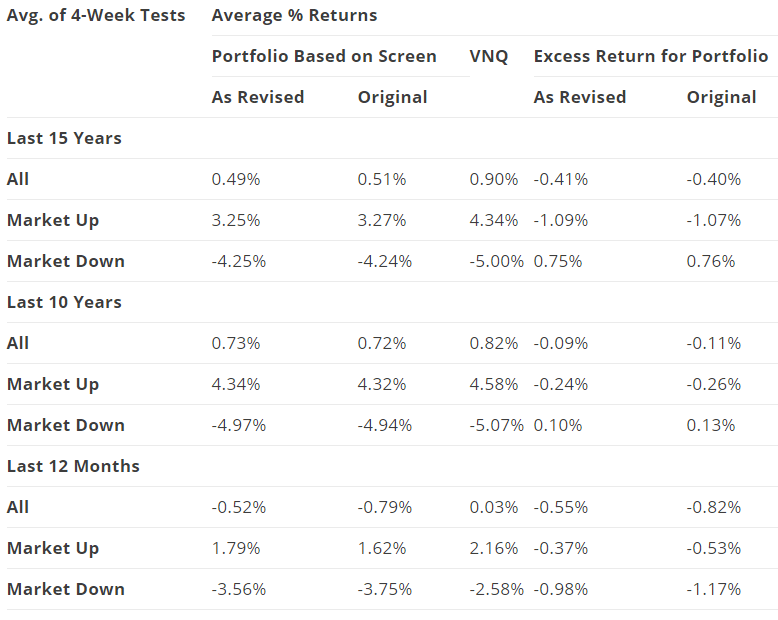
The results of the 15- and 10-year tests are almost identical. In the trailing 12-month test, the revised version of the screen was marginally better than the original, but not by nearly enough to to get met tenure if I were writing as a publish-or-perish academician. And the advantage is trivial enough to warn me that I ought not to tackle any serious dividend persistence research until enough time has passed to create a workable sample for new-interest-rate-paradigm testing.
Stocks
Here are the REITs that currently appear in the revised version of the screen:
CoreCivic (CXW)
EPR Properties (EPR)
Outfront Media (OUT)
W.P. Carey, Inc. (WPC)
Conclusion
The one thing that can be said about the test results is that for better or worse, there seems to be have been no meaningful difference between the original version of the model and the revised version during the test period.
So for now, it all comes down to judgment; preference or the dreaded (in quant-land) h-word; heuristics; My preference is, wherever possible, to favor income plays with less exotic characteristics. REITs, by their very nature, will be somewhat exotic relative to stocks. But when it comes to degree, I can at least choose to favor those that are not more exotic (with respect to composition of distributions) than industry norms as suggested by my highly informal ad hoc study and by NAREIT’s more systematic data collection. It wouldn’t have made a meaningful difference in the past, but since I know the future won’t look like the past, I feel justified in going with my judgment that in the new era, one in which real estate will likely be a tougher business than it has been, a reduction in fanciness and an increase in plain vanilla will be more appreciated by those who invest via the public markets (especially since nothing in the backtest, however tenuous its relevance, suggests I’d have hurt myself had I applied this judgement in the past).
Disclosure: None.


