
Trump Speech And Gold
Trump Speech and Gold
All eyes are on the Trump budget speech scheduled later today. The impatient markets want the POTUS to detail the fiscal spending plan. Moreover, markets are to be blamed here as well, given they rallied as if Trump has a ‘magic growth wand’.
However, reality check was offered by Treasury Secretary who said last week that tax cuts are unlikely to come through before August and that the positive effects of the same are likely to be seen only in 2018.
Furthermore, it is practically impossible for Trump to deliver on the higher end of the expectations, which means a potential for disappointment is high.
There are only two scenarios here - Trump details fiscal plan… at least lays out skeleton of the fiscal plan or keeps mum.
Scenario I - Trump details fiscal plan: We could have Trump Bump -II, although the size of the move would be nowhere close to what we saw from November to mid-February. Still, another leg higher in the risk assets could be seen. That would also boost US dollar and Treasury yields and weaken gold. However, the decline in gold could be short-lived and could be restricted around $1190-1200 on account of rise in inflation expectations.
The Japanese Yen, Euro and GBP could suffer losses against the US dollar. Thus, gold could hold its own in non-USD terms… essentially in JPY, EUR and GBP terms.
Scenario II - Trump disappoints expectations: As said earlier, the odds of Trump failing to meet expectations are high. Trump trade, which is looking exhausted, could deflate, leading to a sell-off in the US dollar against safe haven currencies and gold. The dollar may remain strong against risk currencies/commodity backed currencies like AUD. This is because unwinding of Trump trade would also mean a correction/pullback in the commodities. Thus, AUD could feel the heat.
Inflation expectations could decline as well, but that may not rattle gold as the correction in the risk assets would boost haven demand for the yellow metal.
Gold and 5-year, 5-year inflation expectations
(Click on image to enlarge)
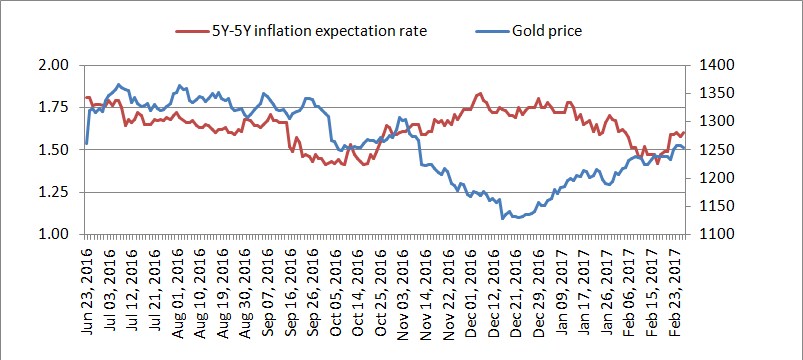
Data Source - https://fred.stlouisfed.org/series/T5YIFR
Chart by - Tip TV
Falling inflation expectations since 2011-2012 also pulled gold prices lower. The correlation weakened following the Brexit referendum. Markets rallied post-referendum, thus opening doors for a Fed rate hike and that pushed gold lower to $1122 (Dec low). However, the yellow metal has done a catch-up job in the first two months of 2017.
Let us have a look at gold market technicals
Daily chart
(Click on image to enlarge)
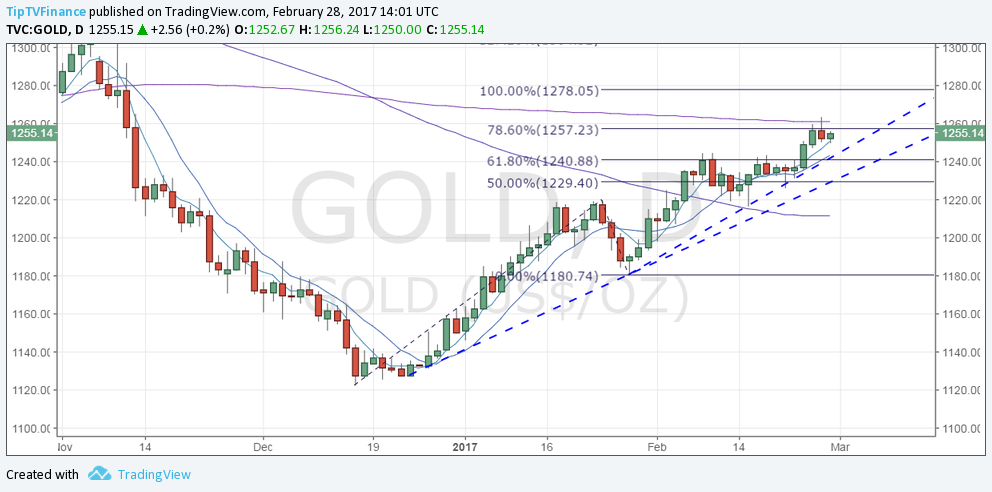
Resistance
$1257.23 (78.6% Fib expansion)
$1262 (200-DMA)
$1278 (100% Fib expansion)
$1300 (psychological figure)
Support
$1251 (Feb 23 high)
$1240.88 (rising trend line + 61.8% Fib expansion)
$1229.4 (rising trend line + 50% Fib expansion)
$1216.80 (Feb 15 low)
- The rising trend line looks solid. The 5-DMA and 10-DMA are rising upwards.
- Prices appear on track to test resistance at $1278… especially if Trump disappoints expectations.
- In Scenario - I, Gold could revisit a larger rising trend line support seen around $1230.
- On the charts, only a daily close below the larger rising trend line would revive the bearish view.
Disclosure: None.


