
Trend Behavior: Comparing US Vs. Emerging Markets Stocks
Standard finance theory tells us to select weights for stocks and other asset classes based on market value. By that standard, emerging markets deserve a relatively light touch in portfolios. But this strikes some investors are misguided. As Frontera, a research shop, noted last year, “Emerging Markets Account for 80% of Global GDP Growth But Only 10% of World Equity Market Cap.”
The US, on the other hand, dominates market-cap weighted indexes. In a recent profile of the MSCI World Index, US equities represented nearly 60% of the benchmark.
No wonder that numerous alternative weighting methodologies have been proposed. Deciding how (or if) to deviate from Mr. Market’s asset allocation has become increasingly popular in recent years, in part because recent research suggests that there’s enough inefficiency in asset pricing to give alternative weighting strategies an edge.
Where to begin? Investors inclined to look to the momentum/trend factor for perspective might start with the return spread between US stocks and equities in emerging markets. These two market facets have engaged in an interesting dance over the last decade that highlights a modest degree of contrarian behavior – behavior that appears to offer a degree of useful guidance on timing for dynamically managing weights.
The caveat is that the contrarian aspect between US and emerging markets equities isn’t strong. The correlation for one-year returns for two proxy ETFs is roughly 0.75 since 2008, based on daily data for the SPDR S&P 500 (SPY) and Vanguard Emerging Markets (VWO). That’s below a perfect positive correlation reading of 1.0, but it’s still far from a negative relationship. Nonetheless, there may be useful information to mine when the SPY-VWO dance has gone to extremes.
As an example, let’s review the one-year return spread for SPY less VWO for the past decade. The setup: calculate rolling one-year performance (252 trading days) for each ETF on a daily basis and then take SPY’s performance and subtract VWO’s. For more perspective, let’s also plot VWO’s price history. For a clearer visual on the data, I’ve rescaled everything by normalizing the spread and price histories via z-scores. The results are shown in the chart below.
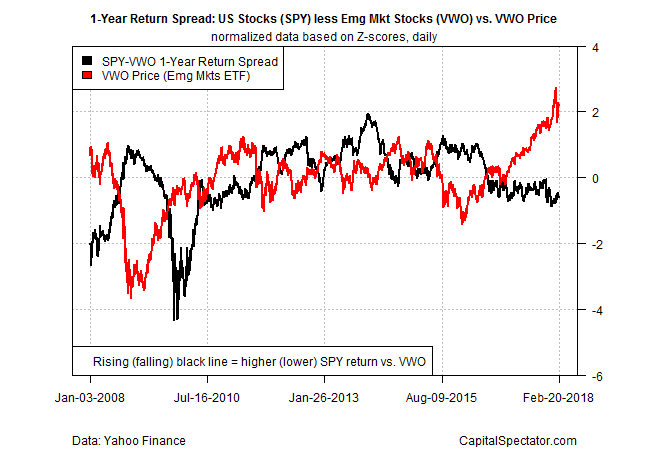
Note that VWO’s latest bull run began in early 2016. At the time, the SPY-VWO one-year return spread was positive and relatively high, which is to say that SPY’s one-year performance was well above VWO’s. In short, it appeared that SPY’s trailing one-year return was comparatively lofty vs. the equivalent for VWO — a gap that arguably laid the groundwork for VWO’s strong rebound.
But after two years, the relative-return fuel tank has been drained, or so it appears. The SPY-VWO spread has turned negative recently. As of yesterday’s close (Feb. 20), SPY’s one-year return (+15.4%) is well below the +22.2% one-year increase for VWO. The negative spread of nearly 7 percentage points contrasts with the positive 20 percentage-point-plus spread in SPY’s favor in early 2016.
Return spreads are hardly a foolproof system for market timing. Nonetheless, monitoring this data can be useful, particularly when the numbers are in the upper or lower ranges of historical results.
With that in mind, the current data suggests a bit more caution on the outlook for emerging markets. True, there’s no law that says that VWO won’t rally further from here. But to the extent that relative returns vis-à-vis SPY mean anything, the low-hanging fruit for emerging markets stocks was picked a number of months earlier.
Disclosure: None.


