Transports Could Be Repeating 1999 & 2007 Now
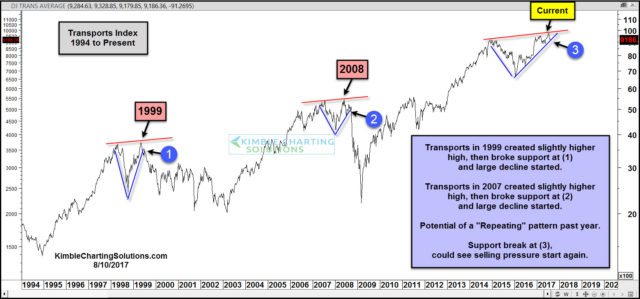
Below looks at the Dow Jones Transportation Index since 1994. Is it possible that the Transports index is repeating the patterns that were created back in 1999 & 2007? Below is an update on a potential pattern that we have been sharing with members for months.

CLICK ON CHART TO ENLARGE
In 1999, Transports closed slightly higher than in 1998, which appeared that a bullish breakout was in play. Quickly the index reversed and broke support at (1), which was followed by a good deal of selling pressure, driving the index much lower. The breakout was nothing more than a fake out in 1999.
In 2008, Transports closed slightly higher than in 2007, which appeared that a bullish breakout was in play. Quickly the index reversed and broke support at (2), which was followed by a good deal of selling pressure, driving the index much lower. The breakout was nothing more than a fake out in 2008.
Over the past couple of years, the pattern in the transports looks a good deal like it did in 1999 & 2007. As we have been sharing with members for month, the odds of a repeat are low, yet if the pattern we are sharing would happen to be correct, the impact could be quite large.
At this time the Transports index is testing rising support at (3). Even if the pattern do not repeat, if support would give way at (3), it could encourage selling in this important index.


