Transportation Stocks Are Not Moving And What It Means
Pay attention to the price movement of the transportation sector for a clearer picture of the future rally.
If you have been reading and following our posts this year then you’ve seen the power of our Advanced Dynamic Learning price modeling system and how well we are able to find key market moves. On Monday, the markets stalled, providing further evidence of the future breakout move. The Banking Index was up 0.43%. The $INDU was off by 0.06% while the ES, NQ, and YM were mixed. The Transportation Index was up 0.40% while the US Dollar is about to break above the $91.00 level on an attempt to move higher. These moves are telling us that the US economy is about to break higher in an attempt to retest recent highs – just as our ADL predictive price modeling system has been a warning.
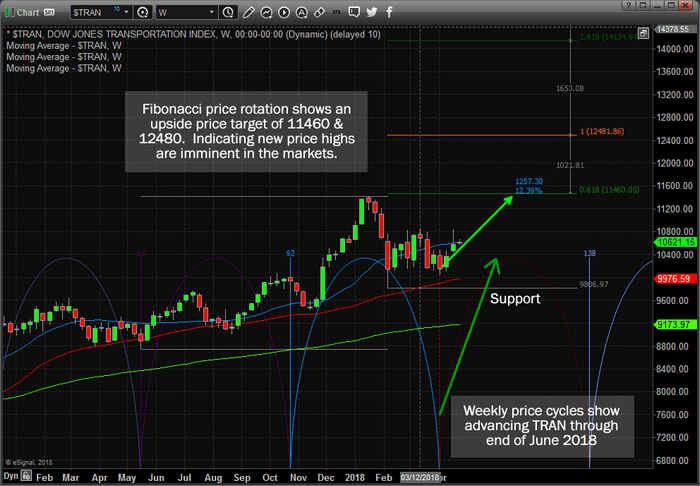
This chart of the Transportation Index clearly shows the Weekly price cycle rotations and the recent cycle bottom that occurred on April 2, 2018 – about three weeks ago. This cycle bottom also coincided with the major market bottom formation and early stage price rally that we’ve been experiencing for the past few weeks. Support is currently at 9800 in the TRANS and we believe this cycle pattern will drive the US major market and TRAN higher till near early July 2018.

We believe this move could be explosive to the upside as our ADL price modeling system shows that anytime a price anomaly setup occurs, price usually attempts to re-balance itself with the predictive modeling behavior in a quick and sometimes violent price move. Be prepared for a potentially explosive upside move here folks.
If you want to know how to take advantage of these moves and stay ahead of the markets, then visit more


