
Topping Pattern Or Just Consolidation Before Another Leg Up?
The U.S. stock market indexes gained 0.1-0.3% on Wednesday, extending their short-term consolidation, as investors continued to hesitate ahead of tomorrow's monthly jobs data release. The S&P 500 index has reached the new record high of 2,940.91 on September the 21st. It currently trades just 0.5% below that high. The Dow Jones Industrial Average gained 0.2% and the technology Nasdaq Composite gained 0.3% yesterday.
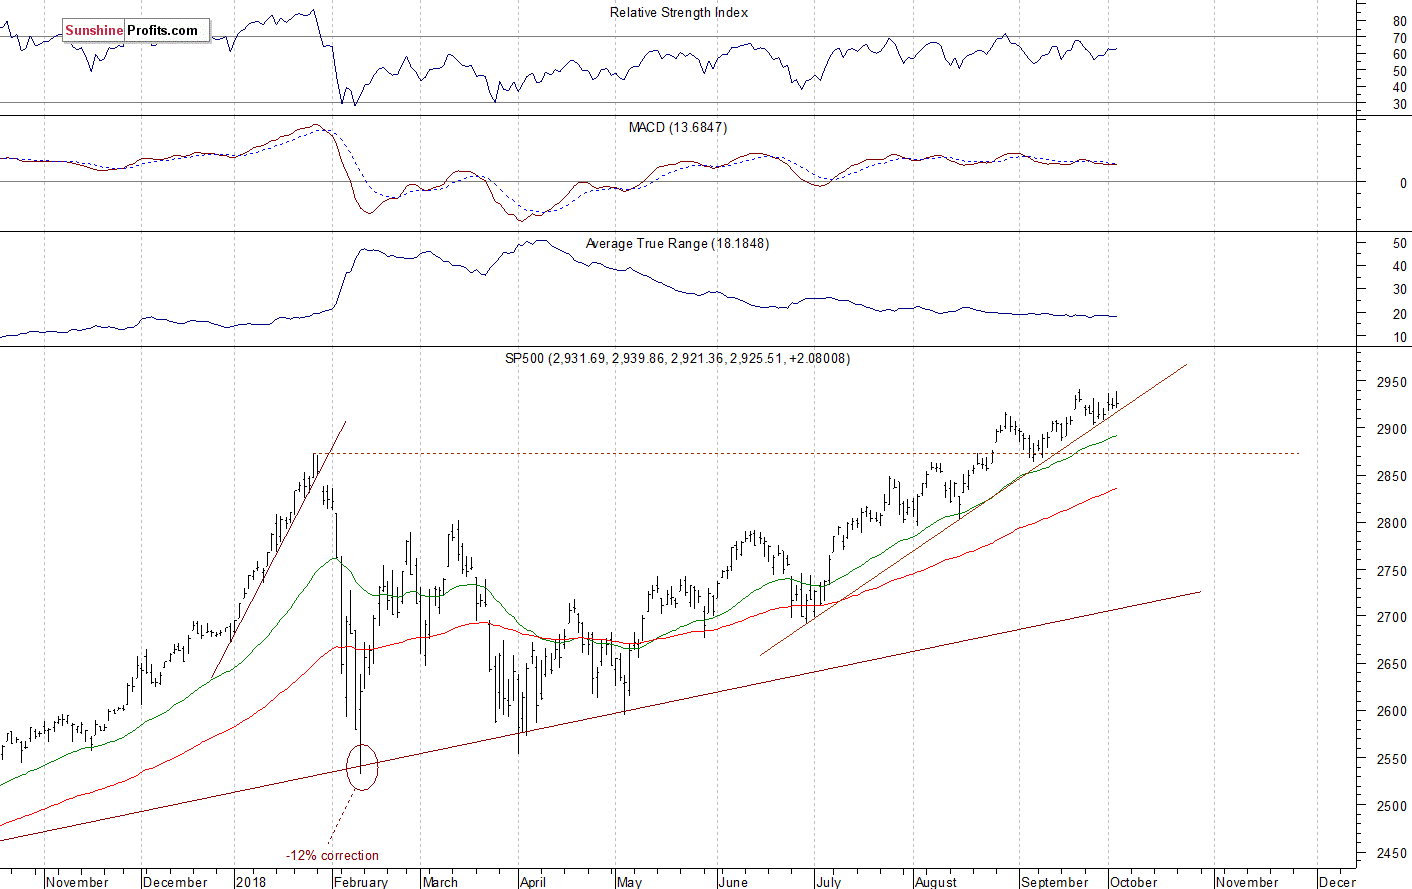
The nearest important level of support of the S&P 500 index remains at around 2,915-2,920, marked by the recent consolidation and the medium-term upward trend line. The next support level is at 2,900. The support level is also at 2,885-2,890. On the other hand, the nearest important level of resistance remains at around 2,925-2,930, marked by the last week's Monday's daily gap down of 2,923.79-2,927.11. The resistance level is also at 2,940, marked by the record high.
The broad stock market reached the new record high in the late September, as the S&P 500 index extended its short-term uptrend above the level of 2,900. Will it continue higher despite some short-term technical overbought conditions? The index keeps bouncing off its three-month-long upward trend line following last Wednesday's upward reversal, as we can see on the daily chart:
(Click on image to enlarge)
Negative Expectations
Expectations before the opening of today's trading session are negative, because the index futures contracts trade 0.3-0.5% below their yesterday's closing prices. The European stock market indexes have lost 0.3-0.9% so far. Investors will wait for some economic data announcements today: Initial Claims at 8:30 a.m., Factory Orders at 10:00 a.m. The broad stock market will likely continue to fluctuate after the recent record-breaking advance. Will the index break above the mentioned September's record high? It's hard to say. If it breaks higher, we could see more buying pressure. There have been no confirmed negative signals so far.
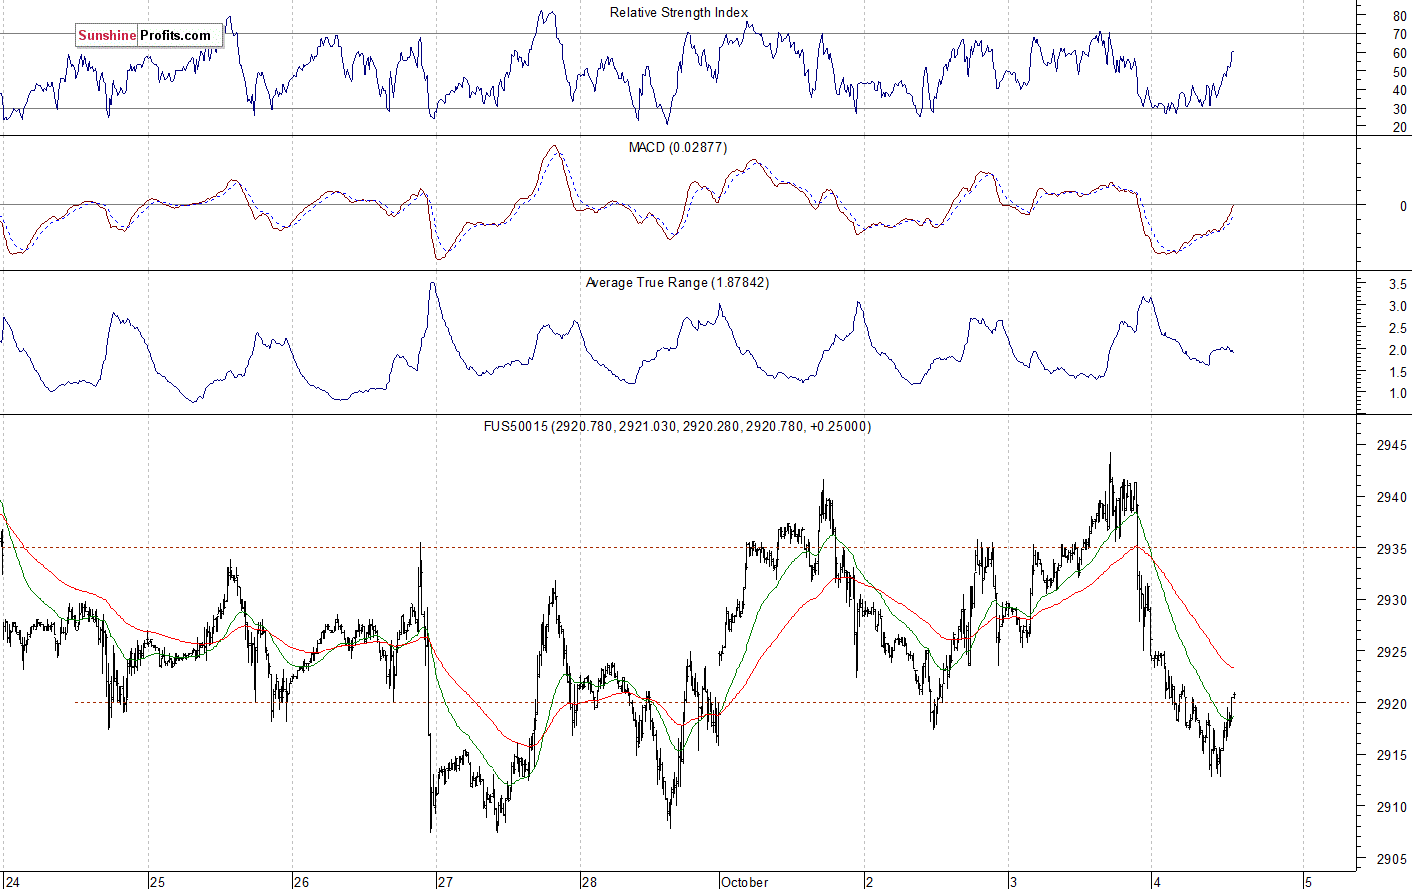
The S&P 500 futures contract trades within an intraday consolidation following an overnight decline. The nearest important level of resistance is now at around 2,920-2,925. The next resistance level is at 2,940-2,945, marked by the record high. On the other hand, the support level is at 2,910-2,915, marked by the recent fluctuations. The support level is also at 2,900-2,905, among others. The futures contract extends its short-term consolidation, as the 15-minute chart shows:
(Click on image to enlarge)
Nasdaq Also Lower
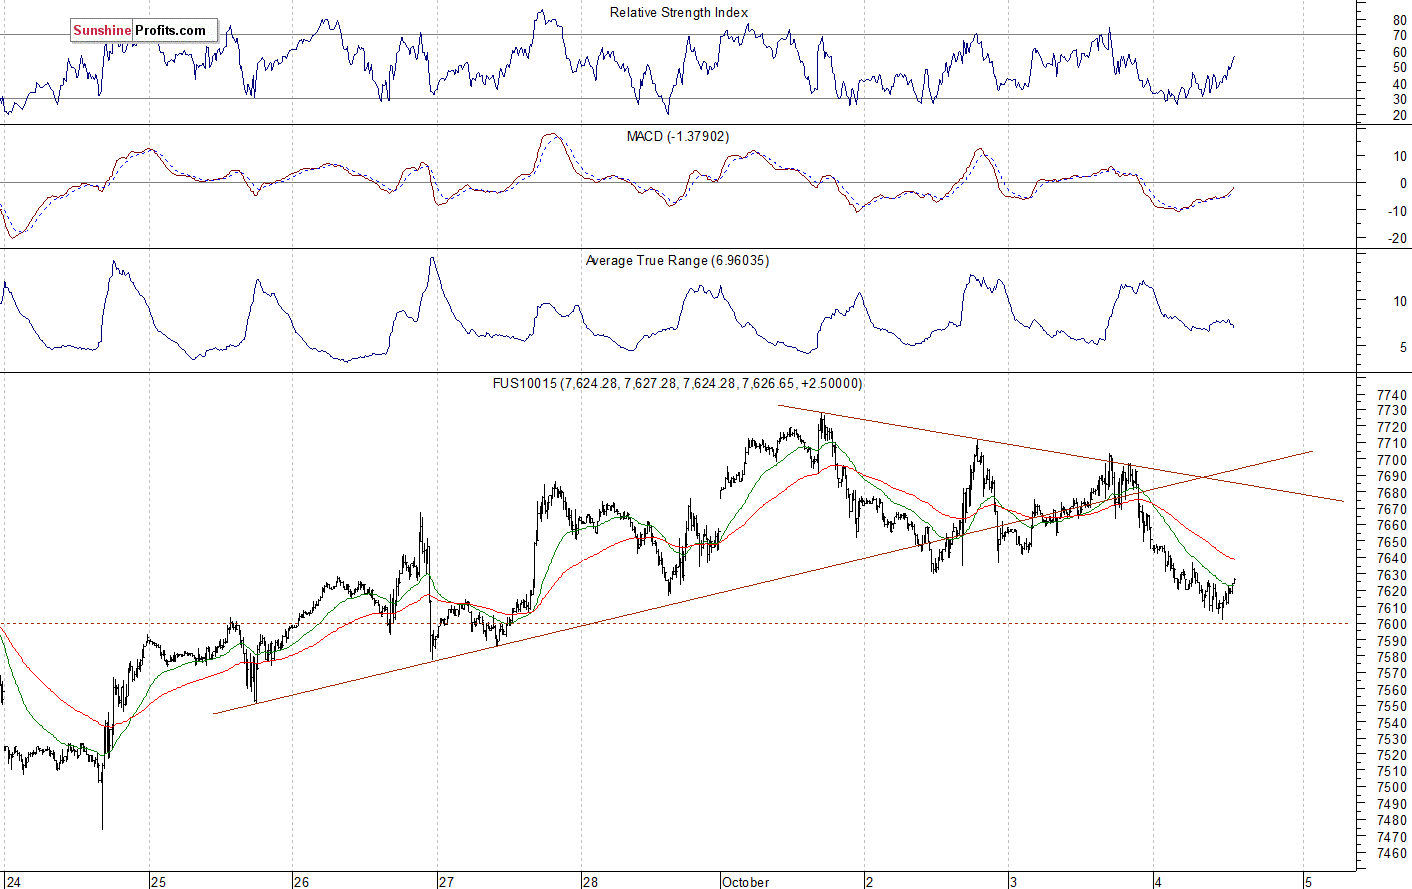
The technology Nasdaq 100 futures contract follows a similar path, as it trades within an intraday consolidation after bouncing off the resistance level of 7,700. The tech stocks' gauge broke above the level of 7,700 recently and it reached the new record high of around 7,729, before reversing lower. The nearest important support level remains at 7,600-7,620. On the other hand, the level of resistance is at 7,680-7,700, among others. The Nasdaq futures contract trades closer to 7,600 mark again, as we can see on the 15-minute chart:
(Click on image to enlarge)
Apple Rallies to New Record, Amazon Lower
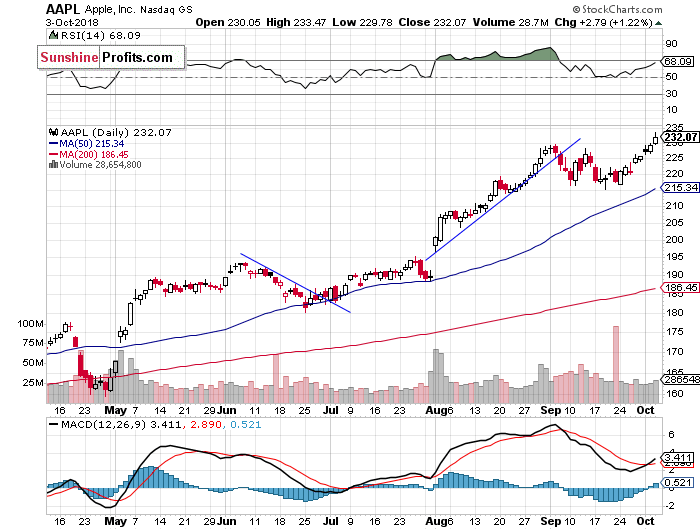
Let's take a look at Apple, Inc. stock (AAPL) daily chart (chart courtesy of http://stockcharts.com). It reached the new record high at the level of $233.47 yesterday, as it continued upwards above its early September high of $229.70. The stock has retraced its month-long correction. Now, we can see some short-term negative technical divergences:
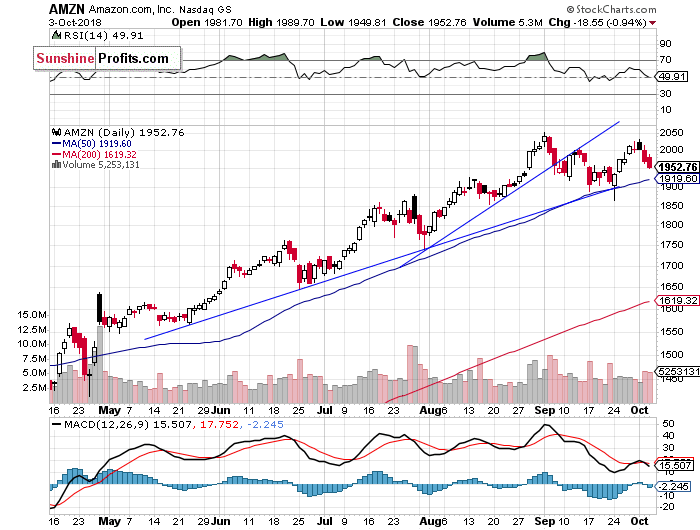
Now let's take a look at Amazon.com, Inc. stock (AMZN) daily chart. It is relatively weaker, as it trades within a short-term downtrend. The stock remains below the month-long upward trend line but it continues to trade above the medium-term upward trend line:
Dow Jones Still Bullish
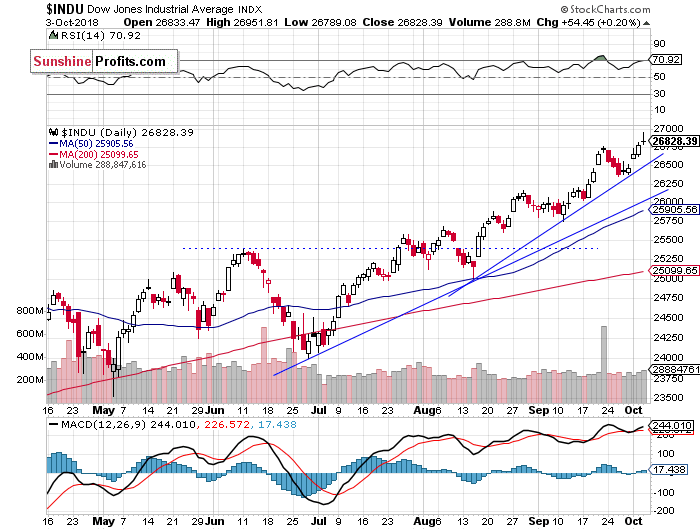
The Dow Jones Industrial Average reached the new all-time high at the level of 26,951.81 yesterday. The blue-chips' gauge got closer to 27,000 mark, but then it reversed its intraday upward course. The support level remains at around 26,350, marked by the recent local low. On the other hand, the resistance level is at 27,000:
The S&P 500 index remains close to its late September record high, but it continues to trade below the level of 2,930. The broad stock market fluctuates following the recent advance. For now, it looks like a relatively flat correction within a medium-term advance, because the index still trades above its upward trend line.
Concluding, the S&P 500 index will probably open lower today. The market trades just 0.5% below its September the 21st high of 2,940.91, so it looks like a relatively flat correction within an uptrend. There have been no confirmed medium-term negative signals so far. But if the index breaks below the mentioned trend line, we could see some more meaningful downward reversal. Investors will wait for tomorrow's monthly jobs data release.
Disclosure: None.


