
Today The VIX Closed Lower And The SPY Closed Lower
- SPX Monitoring purposes; Covered short on 7/6 at 2409.75=gain 1.2%; Short SPX 6/26/17 at 2439.07
- Monitoring purposes Gold: Neutral
- Long Term Trend monitor purposes: Neutral
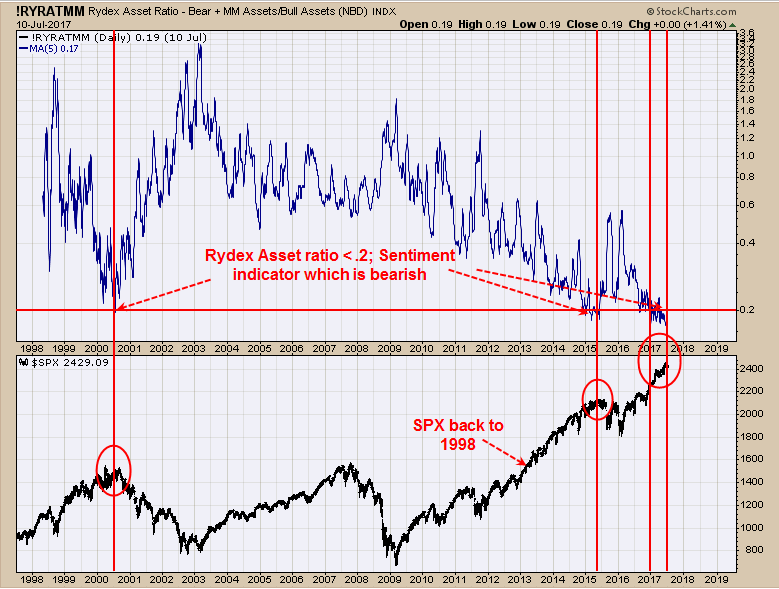
Above is a sentiment indicator; which is the Rydex Asset Ratio minus bear funds plus money market/Bull assets. This ratio shows that the Rydex traders are leaning in the bullish camp where the market has a hard time going higher. We are bullish for this year but there may be need of more work in the corrective side in the market to get this ratio back to the bullish level. We covered our short SPX last Thursday’s but noticed that there was not a “Sign of Strength” off that low (which is needed to confirm the next uptrend). Therefore there may be more work to be done on the downside to get the market back in balance. Covered SPX short for gain of 1.2%.
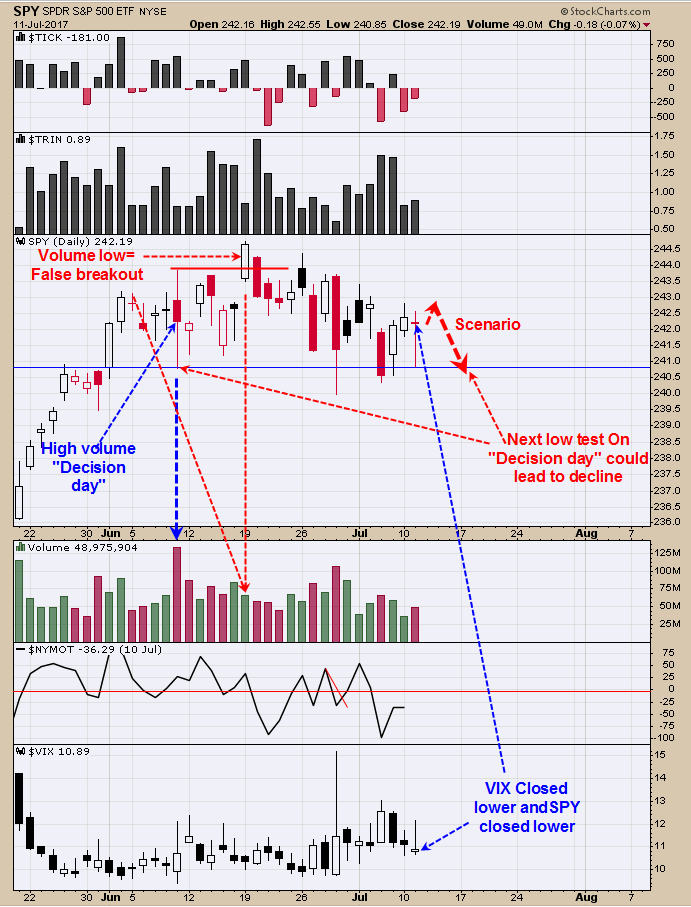
Today the VIX closed lower and the SPY closed lower. The VIX trades opposite of the SPY and suggests the SPY could have an up day tomorrow. We did not see a “Sign of Strength” off of the low Last Thursday’s bottom. A Sign of Strength off last Thursday’s low would have confirmed a decent bottom. With out that confirmation a top may still be building. June 9 had a High Volume “Decision day”. A break above the high of that day on light volume is a bearish sign (Which was June 19 and the day we went short). Over the last couple of weeks the SPY tested the low of June 9 three times, all on light volume and should have produced a decent rally. Since market response was just mediocre and no “Sign of Strength” was present most likely another test of the June 9 low is coming. The more times a low is tested the more likely it will be broken. We could end up with another sell signal.
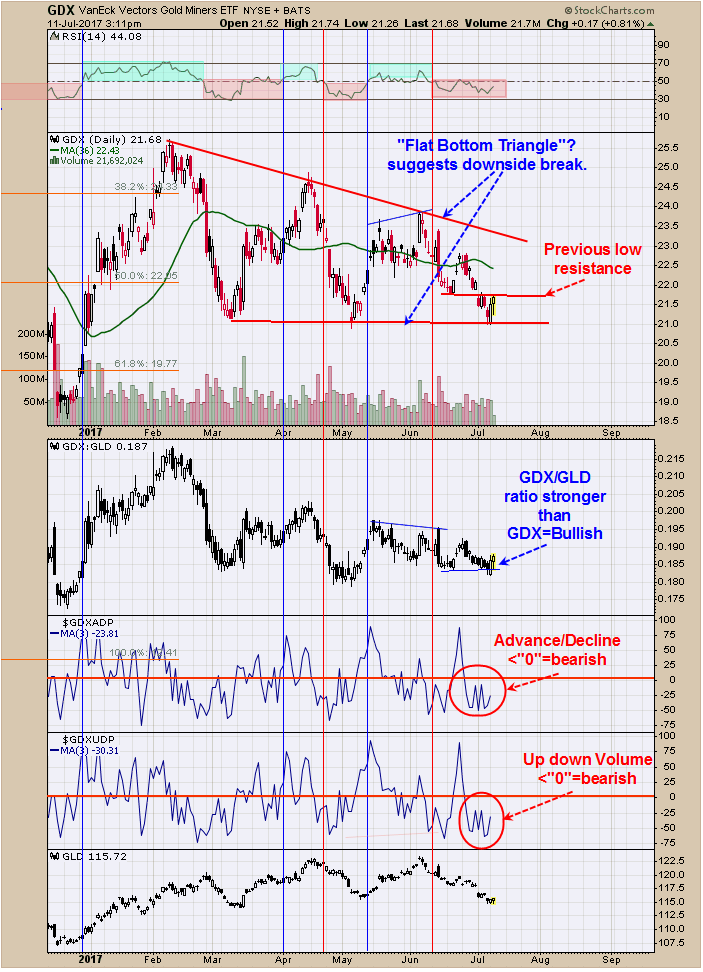
Second window up from bottom is the Up down Volume percent which is “0” and bearish. Next window up is the Advance/Decline Percent which is also below “0” and bearish. The GDX/GLD ratio is outperforming GDX and a bullish sign. The larger pattern forming on GDX could be a “Flat bottom Triangle” which normally breaks to the downside and a bearish sign on the bigger timeframe. Today’s rally ran into the previous low of Mid June and a resistance area. The top window is the RSI for GDX. In up trending markets the RSI stays above 50 and down trending market stays below 50 and today’s reading is 44.08. We are back on the sidelines until the picture becomes clearer for the short term. The monthly Chart remains bullish for GDX and GLD.
Disclosure:
None.
Disclaimer: Signals are provided as general information only and are not investment recommendations. You are responsible for your own investment decisions. Past ...
more


Thanks Sir