
Time Warner Looks Ready To Continue Its Upward Trajectory
Time Warner (TWX) has been progressing higher over the past 13 weeks following a 17.3% correction off the $103.90 peak from October. Support was seen at the $85.88 low. During the subsequent bounce off that low TWX advanced as much as 13.9% as of the $97.81 swing high hit three weeks ago. The following weekly chart shows how TWX has progressed higher while hugging support of its rising trend line drawn by connecting the closing prices. In addition, price is well above the red horizontal line at $89.69, which was the area of prior resistance from the 2015 peak, and now represents support.
The 13-week uptrend can be anticipated to continue unless there is a decisive break below the rising line. A move above last week’s high of $95.93 provides a new short-term bullish signal, with a subsequent rally above $97.81 confirming a bullish trend continuation.
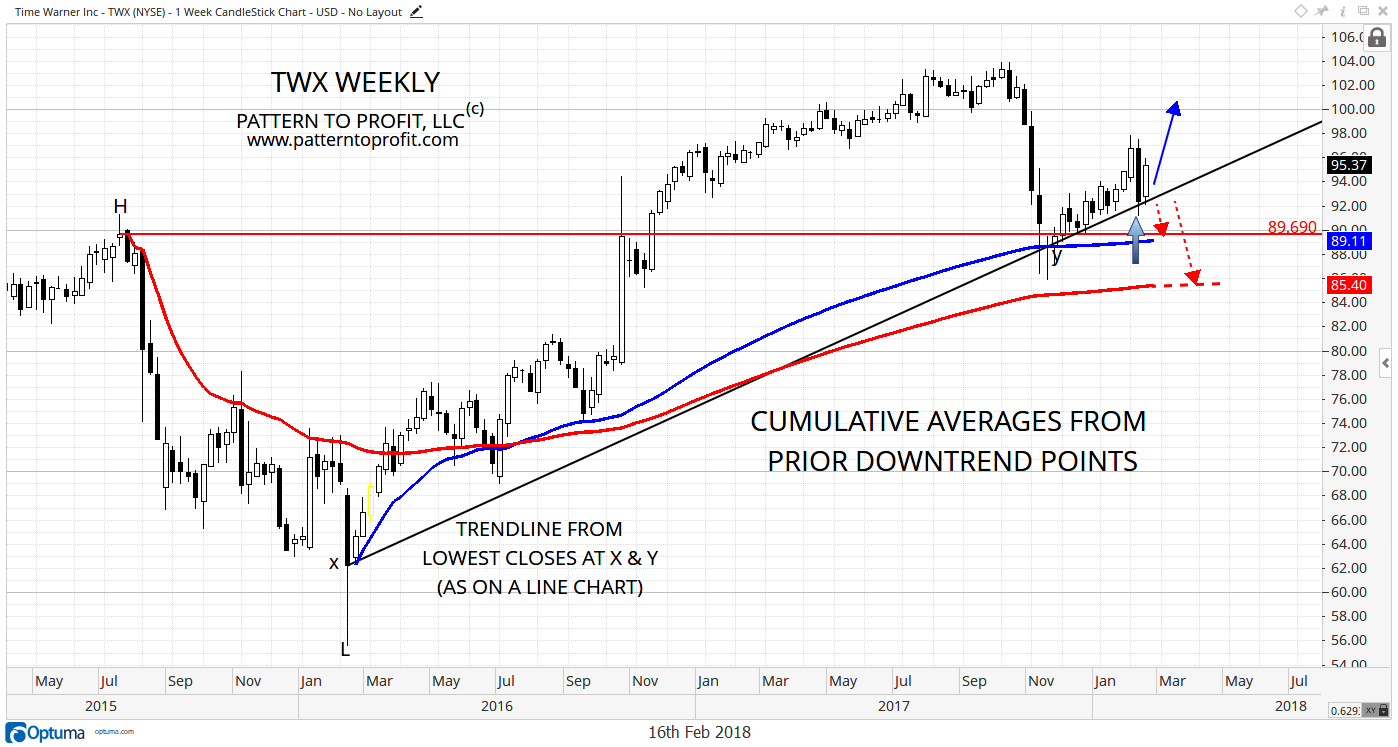
Trend line support is currently at $95.62. A decisive drop below that line will signal a breakdown with TWX next heading towards two cumulative average price support areas. Cumulative averages can be started from either a high or a low. The weekly chart shows a higher support zone at $89.11, which is the blue line that starts from near the January 2016 swing low at point x. A little lower, at $85.40 and near the recent $85.88 swing low, is the red line cumulative average that starts near the July 2015 swing high marked by H.
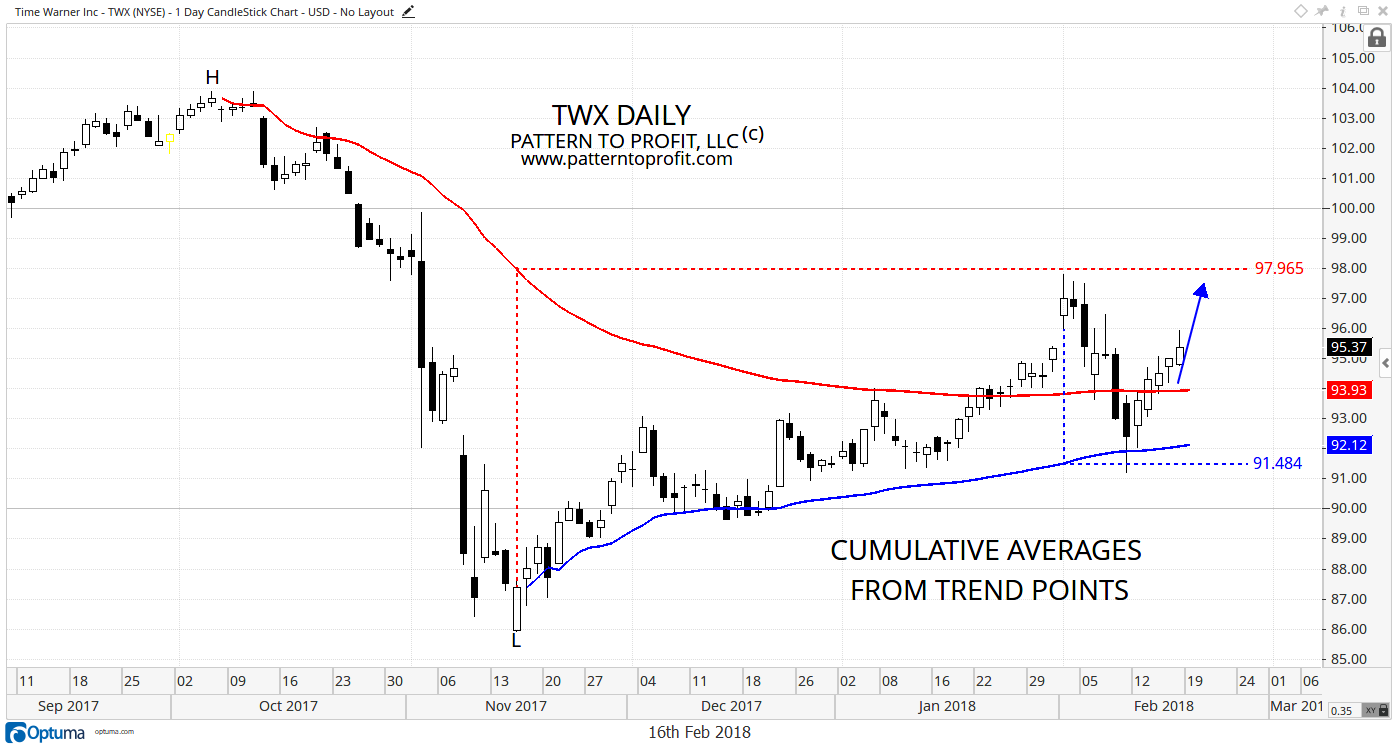
Additional detail on recent price action is provided in the daily chart below. It too shows TWX in a position of strength as price is above the cumulative averages. Again, there are two cumulative averages calculated, one starting at a high (red) and the other from a low (blue). Here we have near-term support of the red cumulative average at $93.93, followed by the blue at $92.12.
Going forward, additional bullish confirmation will be provided when the lower blue line crosses above the red line, as can be seen in the enclosed weekly chart from back in 2016. That event will be needed for confirmation that the current short-term corrective (range-bound) phase is ending.
- Positioned to continue 13-week uptrend following 17.3% correction as long as it holds above rising trend line.
- Rally above $97.81/97.97 signals a bull trend continuation.
- Multiple cumulative averages identify support in case of weakness.
Disclosure: Pattern to Profit, LLC, any affiliates or employees or third party data provider, shall not have any liability for any loss sustained by anyone who has relied on the information ...
more

