
Tilting Slightly Defensive In This Melt-Up Stock Market
(Click on image to enlarge)
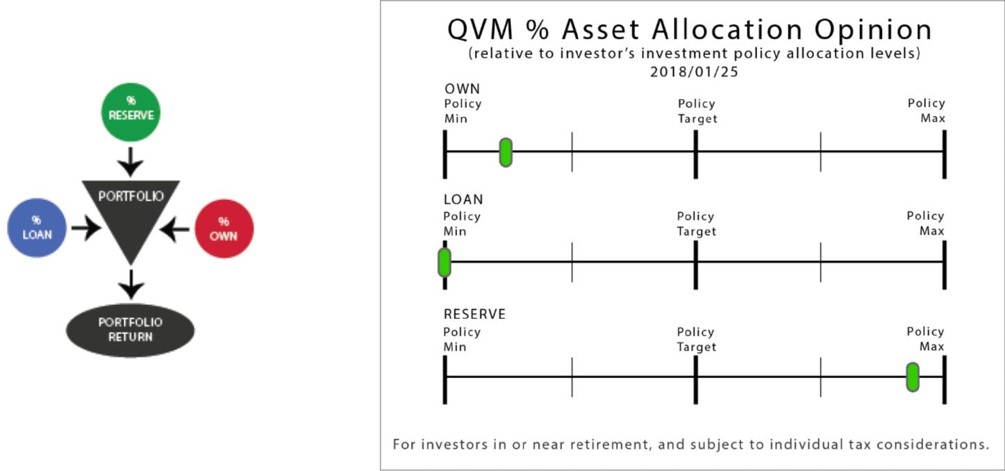
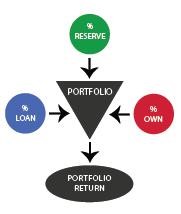
The allocation between Owning, Loaning and Reserving will determine 80% to 90% of your portfolio return. Selections within Own, Loan and Reserve will determine the rest.
OWN: The stock market Bull is very strong, but its sustainability is in question.
Momentum is high, and profits are growing, but valuations are stretched and partially dependent of low interest rates, which now are rising. Advisor and investor positive sentiment toward stocks is extreme, but extreme sentiment is often a contra-indicator.
----International is more attractive than domestic; and emerging markets are more attractive than international developed markets; commodities may benefit from global growth.
LOAN: The historic bonds Bull has turned the corner and is now in a Bear mode.
Bond yields are low and credit yield spreads to credit-risk-free Treasuries are compressed; but interest rates are increasing and will increase more due to (1) Fed overnight rate increases, (2) reduced bond purchase demand from the Fed, and (3) increased supply of new issue bonds from the Treasury. Rising yields will reduce bond prices, which will be an offset to bond yield, resulting in unappealing real (after inflation) and after-tax returns.
----Investment grade floating rate bonds are the most attractive domestic bonds, and US Dollar denominated emerging market sovereign bonds offer the best yield net of inflation.
--- For income-oriented investors, equities, such as high yield stocks, certain limited partnerships, and REITS purchased substantially because of their income characteristics may see their returns impaired, until and unless their payout increases the yield to be competitive with bonds once again.
RESERVE: Yields are rising, but cash is only useful for tactical or operational purposes.
It is nice to get paid something for tactical cash reserves while waiting for better pricing of bonds or stocks, but current real yields are negative for tax deferred accounts, and more negative after-tax for regular taxable accounts. However, that loss is capped at the real, after-tax return, whereas stocks can go down a lot and some bonds are likely to lose more than cash.
Discussion:
Example of Current Allocation Opinion in Use:
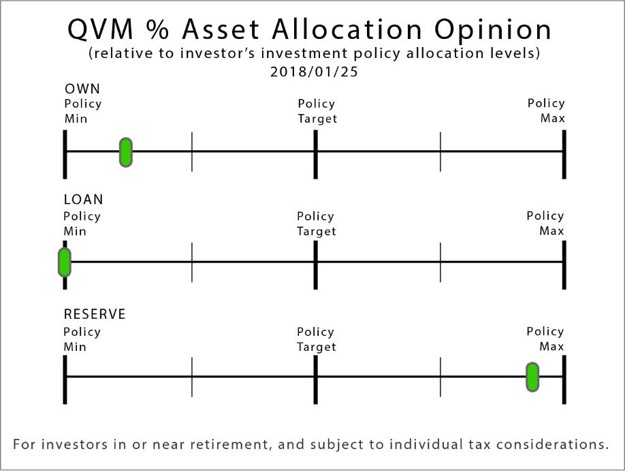
Assume that the investor has all assets in a tax deferred account, so tax considerations are not an issue; and assume that investor’s policy target allocations are: OWN 65% (min 60%), LOAN 35% (min 30%) and RESERVE 0% (max 10%).
That is not an allocation policy recommendation, merely a common policy level among investors in or near retirement.
If the current QVM opinion were implemented, the allocations would be approximately: OWN 62%, LOAN 30%, and RESERVE 8%.
Arguments:
Isn’t it a bit stupid to reduce stocks allocation during such a strong Bull?
YES, it may be if your goal is to squeeze all the potential profit from the Bull; and are prepared to endure a large Correction or the next Bear, or you believe you can exit or reduce stocks at the peak, and not after a large decline (including the instance of a shock event the precipitates an immediate stock decline).
BUT NO, it is not stupid if you would not cope well emotionally or financially enduring a large Correction or the next Bear; or you would want a lower stock allocation before a Correction or Bear; and are not confident that you either could or would make the reduction before the drop. Sleepless nights may not be worth the extra potential. Selling assets to fund retirement during a significant stock decline may reduce your portfolio’s longevity. Nobody ever lost money taking a profit. Even if you do not allocate below your policy target level, you may need to reduce stocks just to get back down to your policy level, given the recent large gains in stock prices.
Isn’t is a bit stupid to hold cash at all?
YES, it may be for amounts over an above what you expect to withdraw over the next 12 months, because with 0.75% to 1.25% current money market rates; and current inflation approaching 2%; and federal, state and local income taxes near 50%; cash is a guaranteed loss of purchasing power.
BUT NO, it is not stupid to the extent that you find it uncomfortable or inappropriate to hold full measures of OWN or LOAN. If there is not an attractive home for all your assets in things to own, or loans to make; then the only other place to put your money (other than under your mattress) is in a cash instrument (money market fund, bank CD or perhaps a ultra-short bond fund with an average maturity of 3 months or less). Cash is a guaranteed purchasing power loss, but that loss is limited, known and more attractive than potential losses you may see as likely in stocks or bonds at various times.
What to Do About Uncertainty?
Investments are always made under some level of uncertainty - sometimes more - sometimes less - but always more than we prefer – now is no different. How do we reason and decide how to invest under conditions of uncertainty?
We make probability estimates about major possible future scenarios, and judge what would be reasonable in terms of history. We then structure portfolios with a tilt toward the most probable scenario, but also able to cope adequately with other possible scenarios; such as a surprise increase or decrease in earnings, or a surprise increase or decrease in inflation, or some sort of market panic.
Portfolios structured to perform adequately under multiple possible scenarios will not in any short period generate the highest possible return. However, such portfolios tend to perform reasonably well over long periods; and tend to avoid the severe negative return periods that are characteristic of equity portfolios that were built to pursue a narrow range of possible favorable growth scenarios.
That brings us to where we are today. Stocks are doing very well, but they appear to be rising at an unsustainable rate – making a strong corrective move likely.
Traditionally, portfolios would reduce the risk of owning stocks with an allocation to bonds to minimize volatility and to maximum negative return periods stocks can produce, but there is a problem now with bonds too.
For Stocks How Much Return Is Too Much to Expect?
In these first few weeks of 2018, the Standard & Poor's 500 is up more than 6%. That rate is unsustainable.
That rate of change so far this year is about 2% per week, which would double the S&P 500 to over 5600 (versus just over 2800 now) by year-end. While doubling of an index is possible from a low point, it is entirely improbable in an advanced Bull market.
The stock market has to slow down its rate of rise a lot to allow the year to make a reasonably probable return – or keep up its pace a while longer, then give a lot back in the form of a 10% or greater Correction.
What Does Price Return History Suggest?
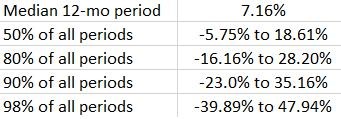
Consider the 1753 rolling 12-month periods for US large-cap stocks since 1871. Only 2 (0.11% of those rolling 12-month periods had a price change of 100% or more). Both were in 1933 as the stock market pulled out of the Great Depression (and the worst Bear market in history). And, only 13 (0.74%) were over 50%. So, based on history, there is much less than a 1% chance of this current market pace continuing throughout the year.
Here is the distribution of the 1753 rolling 12-month changes since 1871. The Median change is 7.16%; and 98% of the periods had price returns between negative 39.89% and positive 47.94%.
What Do Valuations Suggest?
At this advanced stage of the Bull market with stock valuations already very high relative to their history (see relative valuation data here), there isn’t a probability argument to be made for 2018 to be a record breaking price return year.
What Do Trend Lines and Stock Market Breadth Suggest?
Price Trends and breadth say full speed ahead for stocks; and price trends say hold your horses for bonds. That is the message of intermediate-term trend lines, and short-term technical indicators. Stock market breadth is positive and improving (breadth measures show how widely or narrowly the trend is shared among index members – are they moving together, or are only a limited few giant stocks masking broadening weakness among others). New highs vastly outnumber new lows. The percentage of stocks above their moving averages is high. The percentage of stocks with Bullish Point & Figure charts is high. Buying Pressues is higher than Selling Pressure and improving (as measured with the price changes and volume of rising and falling stocks). The major stock indexes keep making new highs.
What’s not to love? Well, sentiment is becoming a problem.
What Does Investor Sentiment Suggest?
I am concerned about excessive exuberance. Healthy skepticism seems to be disappearning.
If everybody goes to the same side of the boat, it capsizes. Just as there needs to be people on both sides of the boat, there needs to be investors on both sides of the value proposition. When “everybody” is a buyer, they evenutally exhaust their buying power; and when new buyers and new money do not continue to flow into a market, the market peaks and corrects or worse. The reverse is also true. When “everybody” is a seller, they eventuall have sold everything they are going to sell; and the marrket bottoms and begins moving up.
Note that “everybody” refers to the active investors, not the quiet money that doesn’t trade based on market cycles, but just holds for the long-term. Most shares don’t turn over in a market cycle – just an active layer on top of a stable core of holdings.
Consider these two measures of sentiment that seem too optimistic.
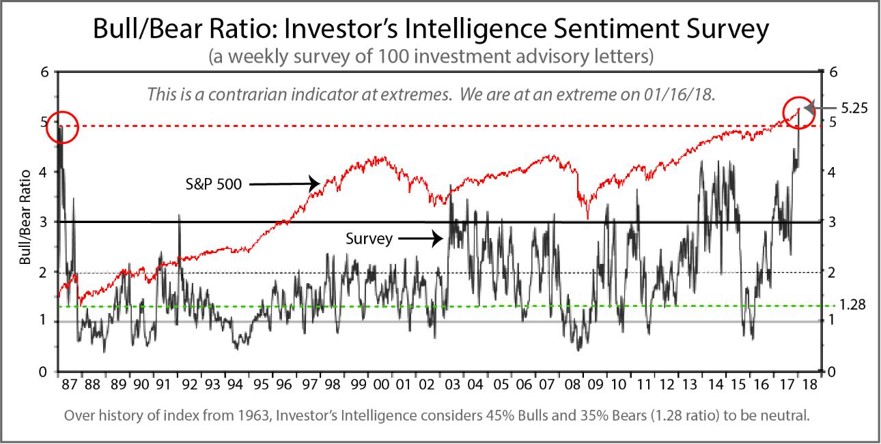
Investors Intelligence Advisor Sentiment Survey:
The weekly Investor’s Intelligence survey of 100 investment advisory letters is at the highest level since 1987 (which was the year in which in a single day, Monday October 19, the S&P 500 fell 22.61%). It did recover quite quickly, but what a day that was. Many investors paniced out at the bottom of that day, and did not get back in until the market had subsequently advanced beyond the pre-crash level.
The survey, like most indicators, is imperfect and only works sometimes; however, the extreme level of optimism today is concerning.
(Click on image to enlarge)
This is what Investor’s Intelligence says about their survey data:
“This survey [inception 1963] has been widely adopted by the investment community as a contrarian indicator ... but only at extremes ... [it is] a key indicator of market reversion ... We study over a hundred independent market newsletters and assess each author’s current stance on the market: bullish, bearish or correction ... a majority of advisors and commentators were almost always wrong at market turning points. Quite simply, professional advisors are just as susceptible to market emotions as individual investors – they become far too greedy at the top of trends and far too fearful near the bottom. ... We consider the norm to be 45% bulls, 35% bears and 20% neutral.[that is a Bull/Bear ratio of 1.29 versus the current ration of 5.25] ... To summarize, advisors are only wrong when you get too many of them starting thinking the same thing.”
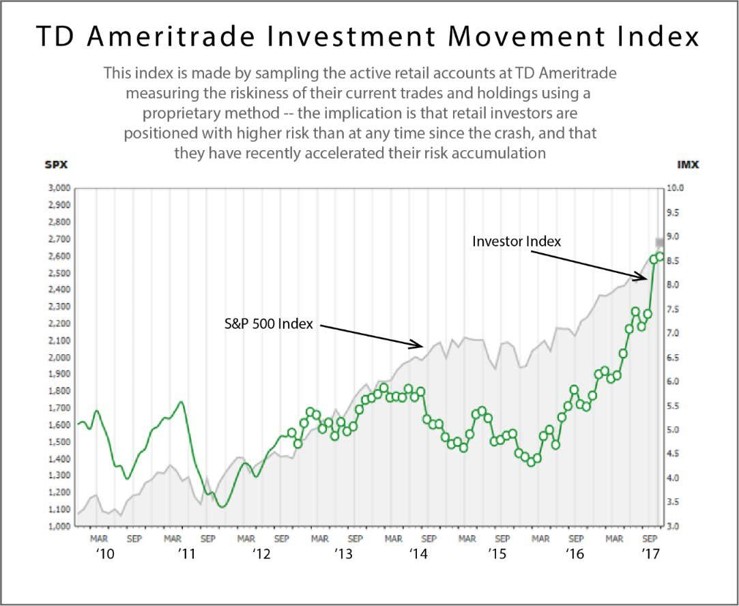
TD Ameritrade Investor Movement Index:
Retail investors have the highest risk profile in their portfolios they have had since the index inception in 2010.
TD Ameritrade says, “The IMX reached an all-time high for the second month in a row ...TD Ameritrade clients were once again net buyers, increasing exposure to equity markets during the December period.”
(Click on image to enlarge)
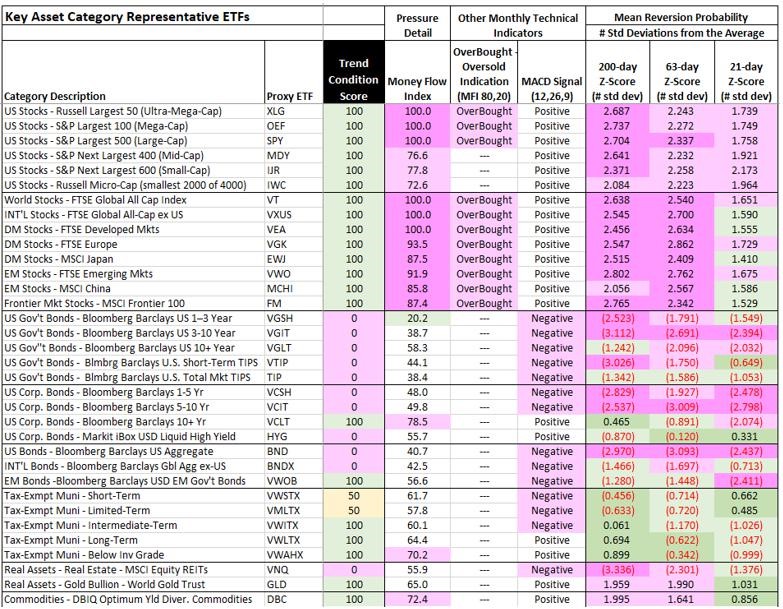
Some Detail on Trend Lines and Technical Indications:
Price trends of stocks are positive, and price trends of bonds are negative; but the magnitude of trend movements in stocks is typically much greater than for bonds.
- Monthly intermediate-term trend stock indicators are in strong uptrends o but heavily overbought based on the Money Flow index
oand far away from their moving averages measured in standard deviations
- Monthly intermediate-term trend bond indicators are in mild downtrends
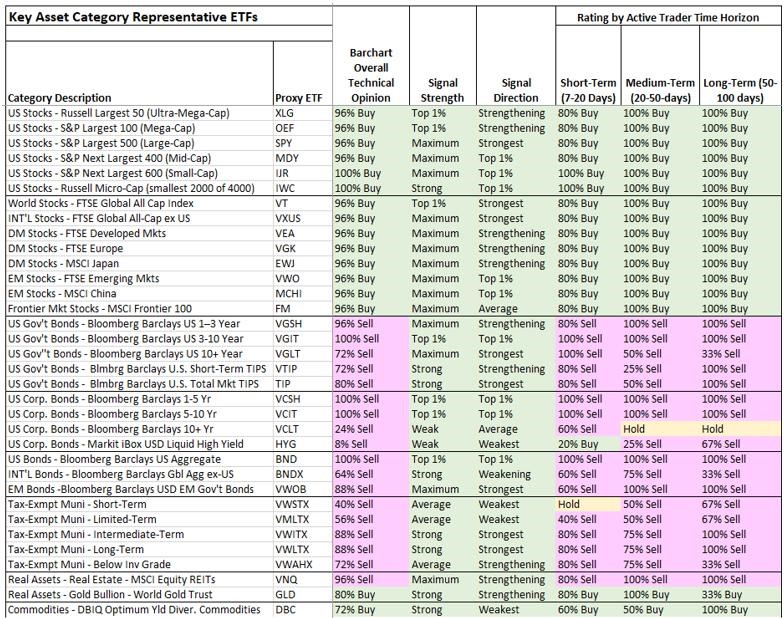
- Traditional short-term technical indicators for stocks are strongly positive
- Traditional short-term technical indicators for bonds are strongly negative
QVM Intermediate-Term Trend Indicators
(Click on image to enlarge)
BarChart Short-Term Technical Conditions
(Click on image to enlarge)
The Problem With Bonds:
In summary, bonds have probably begun a Bear market, which means negative price changes will be offseting interest payments, to create low returns. On top of that, with 2% inflation and with federal, state and local taxes exceeding 50% tax in many cases, there is a negative, real, after-tax return from most bonds.
A number of prominent investment thinkers have declared the Bear market, among whom are Bill Gross (former “bond king” at PIMCO), Jeff Gundlach (current “bond king” at DoubleLine) and Ray Dalio (CEO or the largest hedge fund in the world with about $160 Billion), and others.
For example, at Davos this week, Dalio said we are in a bonds Bear, and noted “A 1% rise in bond yields will produce the largest [bond] Bear market that we have seen since 1980 to 1981.”
Here is what JP Morgan says in their 2018 Q1 “Guide to the Markets” about an increase in interest rates:
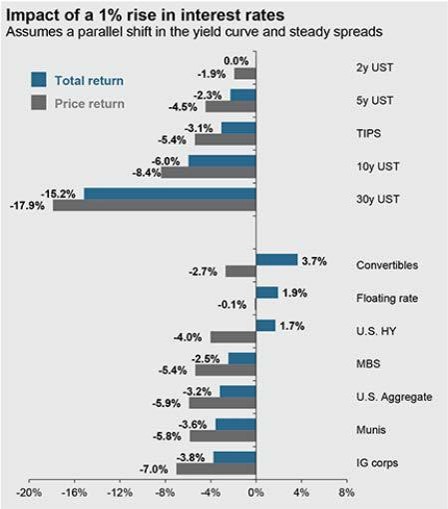
Given that the Fed has plans to raise overnight interest rates by 0.75% this year, and that the increase could cause other rates to shift up by a similar amount along the curve, only 3 types of bonds in this list appear to offer positive return potential: convertible bonds, floating rate bonds and high yield (below investment grade) bonds.
For us that narrows down to only floating rate bonds (which do nothing more than break even with inflation before taxes), because convertible bond and high yield bond prices are also highly correlated with stocks prices. That means if stocks go down, those bonds are likely to go down in sympathy.
Since bonds are meant to reduce portfolio risk from stocks, adding bonds that tend to move in harmony with stocks does not accomplish the risk moderation role we seek in bonds for our portfolios.
The Problem With the History of Bond/Stock Allocation Returns Used To Set Expections:
For a long time, investors and advisors have looked at historical returns of bond/stock allocations to try to project what may be in store going forward. A very big problem with that is that bond yields have been in decline for over 35 years, resulting in bond prices being on the rise for 35 years. Now that is reversing – yields are rising and prices are declining. That new trend will probably persist for several years as yields “normalize”.
This is the JP Morgan 10-year forecast for bond returns:
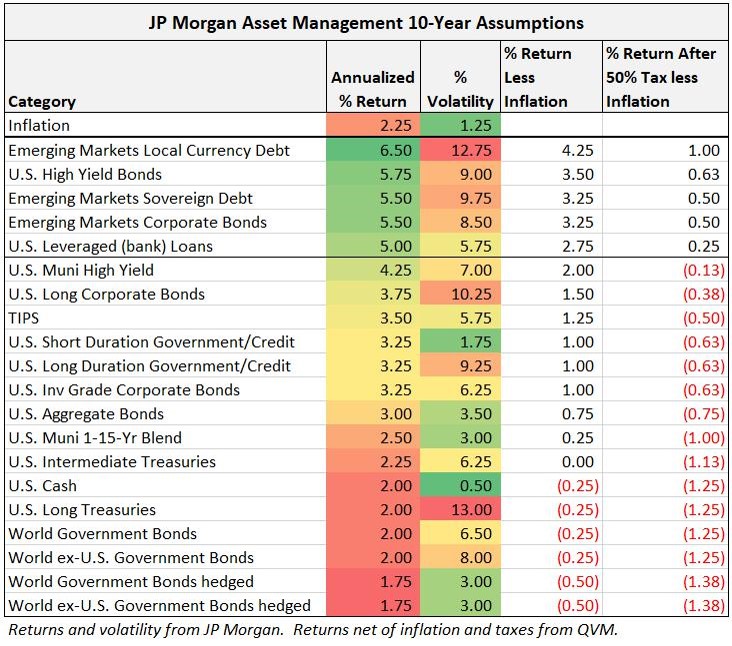
Yields most likely hit bottom in 2016, and have been rising since. With central banks stoping or moderating bond purchases, and not reinvesting maturing bonds, and in some cases (like the US Fed) raising borrowing costs, yields will rise futher – and as JP Morgan pointed out, prices will decline, offsetting yield return; and in some scenarios creating a negative total return.

From the peak of interest rates in the early 1980’s, bond total returns have been a combination of yield plus price gains due to falling interest rates. Now we face yield less price losses due to rising rates. That makes allocation results of the last few decades an overstatement of what is likely to be acheivable over the next 10 years.
Over the next 1-year and 3 to 5 years, however, returns may be less that the 10-year expectations, as the interest rate cycle ramps up, based on forecasts by State Street Global Advisors
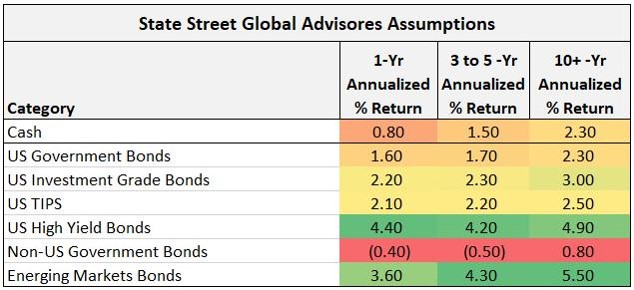
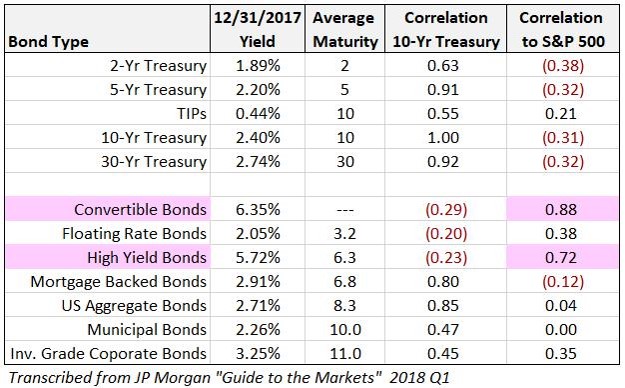
State Street did not provide correlations, but using JP Morgan assumptions, non-US Government bonds will have a 0.23 correlation to the S&P 500; and Emering Markets Bonds will have a 0.53 correlation to the S&P 500.
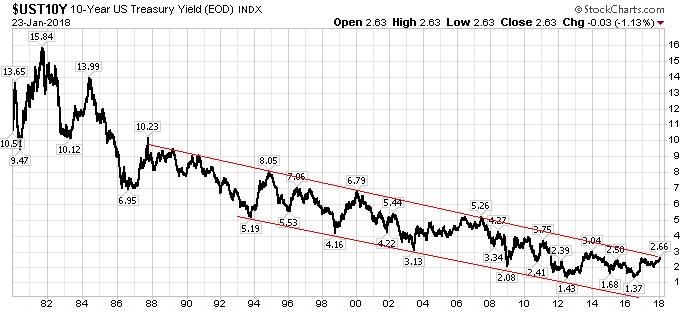
For perspective, this is a chart of the US 10-year Treasury yield from the peak in the 1980’s to the present. You can see the downward channel, and that the current rate is about to break out above that channel. You can also see the bottom 1.37% rate in 2016.
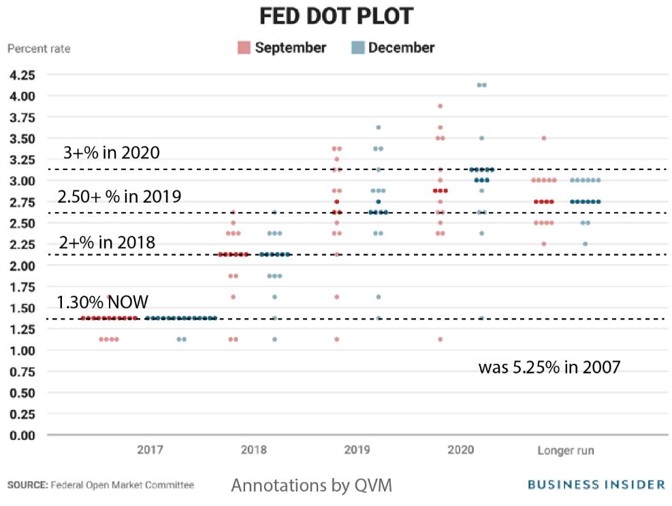
Strong evidence that the current rate will continue out of and above the multi-decade chanel is based in great part of the Federal Reserves “Dot Plot”, where the governors all submit their individual forecasts, which are then plotted as dots on a chart.
The area where the dots cluster is presumably the best bet about future overnight rates, as shown here:
Recapping Our Recommendations, and Our Actions Where We Have Discretion
Our plans, which we outlined in our last letter (available here), are:
- OWN: Allocate stocks at or below the each client’s long-term investment policy target (but within the long-term invesment policy range)
o Allocate US stocks below the the world weight, and allocate intenational stocks above the world weight, with additional overweight to emerging market stocks
- LOAN: Allocate bonds at the bottom of the investment policy range
- Allocate bonds to floating rate, investment grade categories
- RESERVE: Allocate cash above the long-term target, to avoid the short-term price decline risk of bonds and to position for possible investment opportunity upon stock Correction.
Disclaimer: "QVM Invest”, “QVM Research” are service marks of QVM Group LLC. QVM Group LLC is a registered investment advisor.
Important Note: This report is for ...
more


Good advice.