
This Pullback Is Important… But It's Not What You Think
The markets as reflected by the Dow Jones Industrial Average dipped as much as .15% on Friday to close .03% lower than they did on Thursday's close, giving us the first pullback in something like eight trading days.
Markets pared those miniscule losses in mere minutes yesterday morning to hit – you guessed it – fresh record highs before easing back down at midday.
After such a strong move up, a pause is a normal, healthy market response.
But the important thing is not that we get pullbacks like the one we just had – and the one we'll inevitably get again. Rather, it's the nature of the pullback itself.
Let me give you some charts I made the other day that will show you where we stand…
I Look Forward to Pullbacks Like These
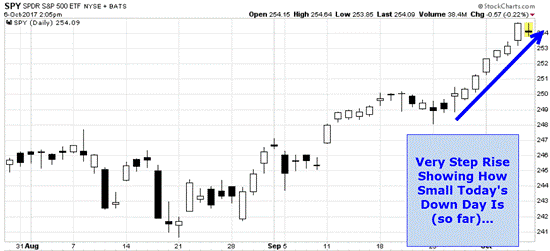
Here's a chart I made on Thursday, Oct. 5, as the cable news pundits were worried about the "end of the rally." It was nothing of the sort, of course.
And now, here's a look at what has happened after other similar steep up moves over the last six months – you'll see a pattern immediately:
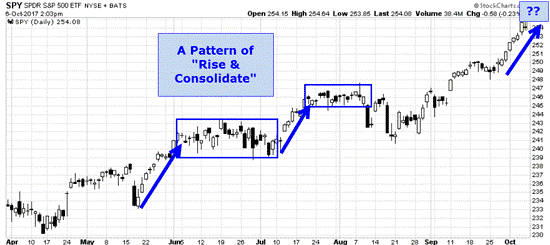
This is a textbook, picture-perfect example of the "grinding bull"-type markets we've had for months now.
And, as I've said numerous times before, I don't expect the grinding bull to fizzle out or change anytime soon. The markets should remain in the current "mode" (a rounded top will be our cue that they've changed), so we can expect future pullbacks to be very modest indeed, and always followed by a sideways consolidation.
But, of course, nothing lasts forever.
These Are the Important Levels to Watch
Now, I think it's unlikely the markets will lapse into even a modest pullback; I think the positive corporate reports I expect we'll get this week will simply prove too tasty to buyers, pushing the grinding bull higher.
But surprises can happen…
In the rather unlikely event markets should somehow prove unable to hit highs this week and they transition into a deeper pullback, here are the key levels to watch:
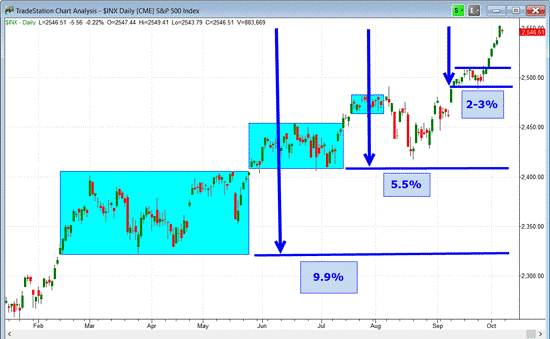
From yesterday's all-time S&P 500 high, a modest grinding bull pullback-and-consolidation range would entail a 2% to 3% drop.
Nothing to write home about, but of course a chance to snatch up some good deals on quality stocks.
A deeper drop to the support level at the bottom of the June-July box would be a very normal 5.5% pullback.
And we haven't had a pullback greater than 5% since the short-lived "Brexit" sell-off of June, 2016, more than 15-and-a-half months ago.
That shows the nature of this "up only" market…
Should events come to it, the next line of defense is the bottom of the February-May box.
And a drop that doesn't go below that key support level would give us a 9.9% pullback – the likes of which we haven't seen since mid-to-late August 2015 – that's just shy of an official correction.
The bottom line is that a pullback from here, up to a certain point, is normal.
Watching the market activity over the next two to 10 trading days will tell us the nature of the pullback.
Disclosure: None.


