
These Sectors & Companies Are Most Exposed To Higher Rates
There are three main types of debt: household debt, corporate debt, and government debt. We think the most debate surrounds corporate debt because it is understood households have deleveraged this cycle and government debt has gotten worse. To be clear, there are debates on those categories because some say household debt in specific areas like autos and student loans are a problem and there are endless discussions about whether heightened government debt is a problem.
With corporate debt, we know it can be a problem if it gets out of control, but the question is how bad the situation is. Depending on how you interpret the data, it can look appear like a normal situation or a big problem. One thing we won’t look at is debt to GDP because corporate debt has no relationship to GDP. A corporation with a lot of debt won’t be bailed out by GDP if it can’t make its interest payments. We know there have been exceptions where companies get a government bailout, but as a whole, corporations pay their debt through cash flow or the issuance of more debt which has nothing to do with GDP. Also, and more importantly, most S&P 500 companies and the US publicly traded companies in general, are more global than ever before, so comparing them to the home country GDP is not an accurate measure to gauge indebtedness.
Ratings Are Getting Worse
One of the big disasters from the 2008 financial crisis was the failed debt ratings by the ratings agencies. This cycle, the ratings agencies are determined to avoid making the same mistakes. As you can see from the chart below even though corporate earnings have increased and the economy looks strong, corporate debt ratings have gotten worse.
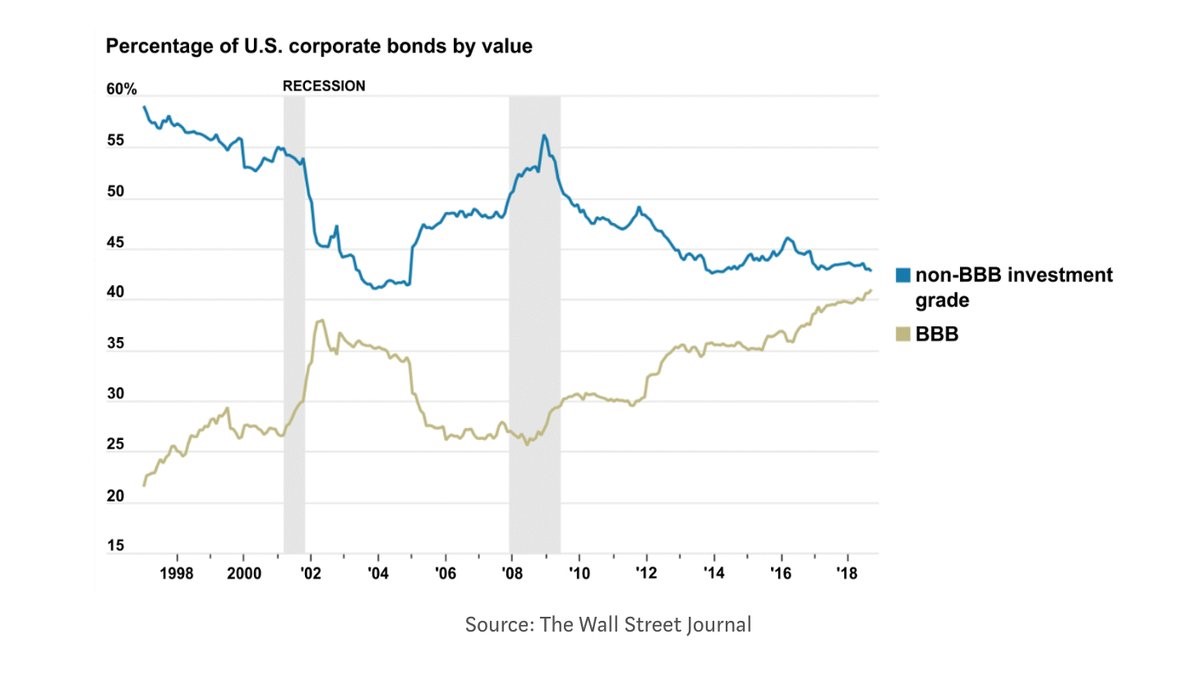
Source: Wall Street Journal
The percentage of BBB rated debt has increased to above 40% which is the highest since at least 1997. The percentage of non-BBB rated investment grade debt has fallen to the low 40s. To be clear, BBB rated debt is in the lowest tier of investment-grade debt (BBB- is the worst). Heightened debt levels are hurting corporations’ scores. In 2007 there were 55 corporations with a perfect AAA rating. In 2010, after the financial crisis, it fell to just 27. Now there are only two firms with AAA rated debt: Johnson & Johnson and Microsoft.
It’s worth noting that value stocks tend to have higher debt than growth stocks. In this period where debt ratings have fallen, value stocks have underperformed growth stocks. There is a lot more to this relative performance, but that’s something to consider as well.
Large Caps Versus Small Caps
Let’s look at the debt composition of S&P 500 firms and Russell 2000 firms. We’ll use the S&P 500 as an estimate of large caps and the Russell 2000 as an estimate for small caps. As you can see from the top chart below, S&P 500 firms have most of their debt in long-term fixed bonds. That’s the most secure type as it won’t change, and it’s locked up for a prolonged period, unlike short-term bonds.
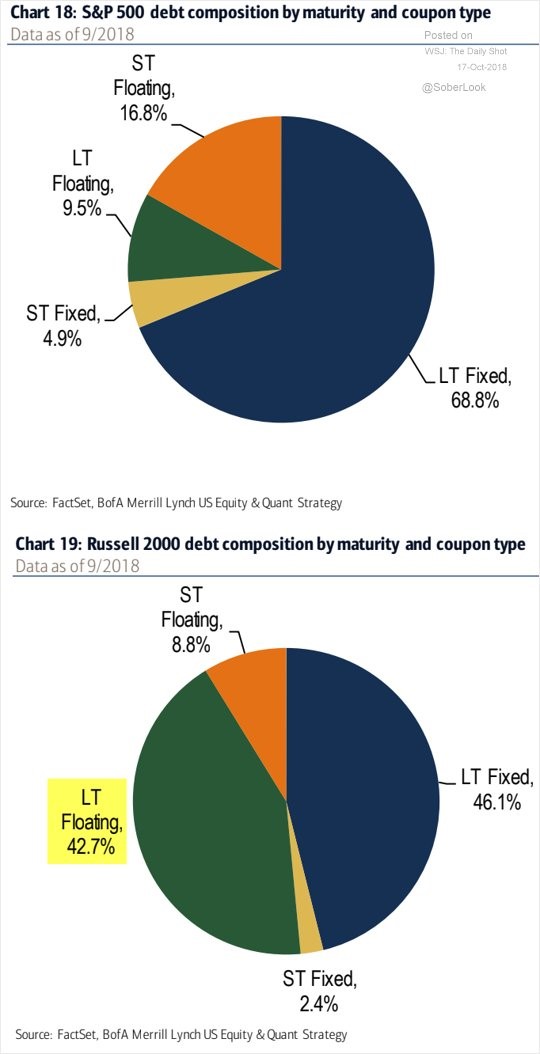
Source: Merrill Lynch
The least secure type is floating bonds as the rate changes. Problems arise when interest rates increase or when a recession catalyzes the spread between junk and investment grade debt to spike. As you can see from the bottom chart, Russell 2000 firms have 42.7% of their debt in long-term floating bonds. Rising interest rates haven’t been kind to these firms. The situation can get worse for the highly indebted ones if the spread between junk and investment grade bonds spikes.
This large percentage of floating rate debt is like when households had adjustable rate mortgages. Those mortgages sounded good because they offered lower rates. Borrowers took on the risk of rising rates and many defaulted. Currently, some student loan debt is variable. It’s a terrible idea to have variable rate debt when interest rates are low because there is much more downside than upside. The goods news is adjustable rate mortgages are very rare now.
Small Caps Not In Dire Straights
While small caps have floating rate debt, which can be a ticking time bomb, the good news is their earnings are improving. As you can see from the chart below, the next 12 months of S&P 600 earnings have been increasing while the index has fallen. This correction will be a buying opportunity if those earnings estimates are realized.
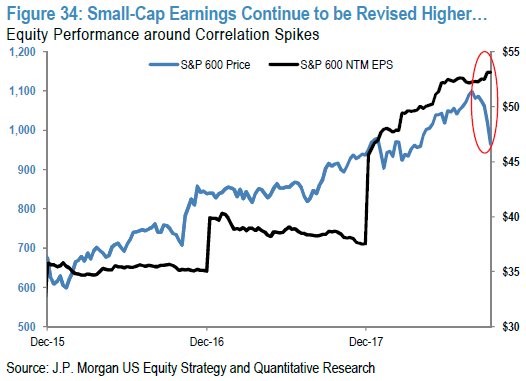
Source: JP Morgan
Small caps had outperformed the market earlier in the year when the tariffs were a big issue because small caps are insulated from that problem and potentially helped if the dollar rallies. They have been underperforming recently because their leverage and type of debt are problematic in a rising rate environment. Treasury rates have soared since late August which is when the Russell 2000 peaked.
Sectors With The Highest Debt
As we mentioned, corporate debt to GDP isn’t a good way to understand corporate debt. One way which actually relates to companies and not the whole economy is net debt to EBITDA (earnings before interest, taxes, depreciation, and amortization). Some investors despise EBITDA because firms can use it to manipulate their results through accounting shenanigans.
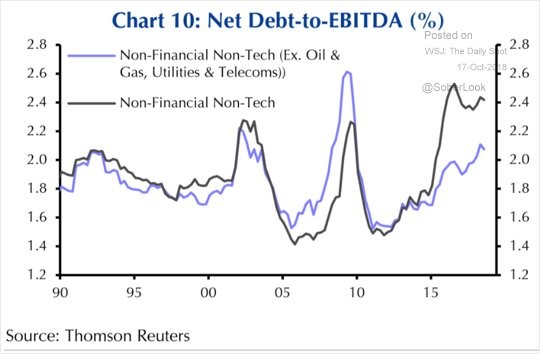
The charts below show us which sectors have the biggest debt problems. First, we have a chart which shows non-financial debt to EBITDA is elevated like it was after the past two recessions.
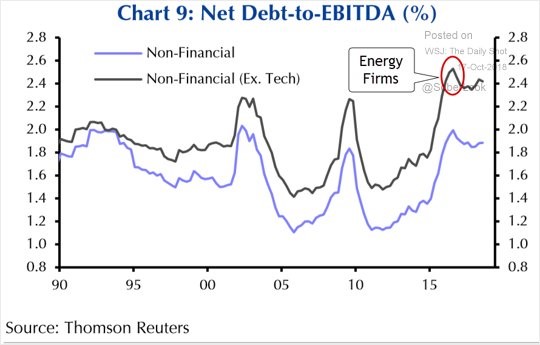
Source: Capital Economics
If EBITDA were to fall during a recession, this ratio would increase even further. The ratio which excludes tech firms is higher because tech firms are generally growth names with low debt.
The chart below gives us further insight into the debt situation of each sector. As you can see, the non-financial non-tech net debt to EBITDA ratio increases when you include oil and gas, utilities, and telecoms. This shows us energy, utilities, and telecom are the problem. If you were to include tech and only exclude those sectors, it would be even lower.
Source: Capital Economics
Conclusion
Small caps are starting to feel the pressure from higher rates because they have a lot of floating rate debt. Their earnings are set to increase, but bearish traders may be right to sell if rates keep increasing. The overall corporate debt market has seen an increase in low rated debt. The energy, utility, and tech sectors are the most exposed to higher rates. Generally, telecom stocks and utilities fall when rates rise because their stocks trade off their high dividend yields almost like a bond. Their high debt can mean higher rates offer an additional negative for these sectors. The energy sector is built on debt which is why the junk bond market sold off when oil fell from late 2014 to 2016. In 2016, Exxon Mobile lost its precious AAA rating, leaving Johnson & Johnson and Microsoft as the only 2 AAA rated firms.
Disclaimer: Please familiarize yourself with our full disclaimer here.


