
The VIX Has Been Running And Staying Low For An Extended Time
- SPX Monitoring purposes; Covered 12/30/16 at 2238.83= gain .46%; Short on 12/29/16 at 2249.26.
- Monitoring purposes GOLD: Long GDX on 12/28/16 at 20.25.
- Long Term Trend monitor purposes: Short SPX on 1/13/16 at 1890.28
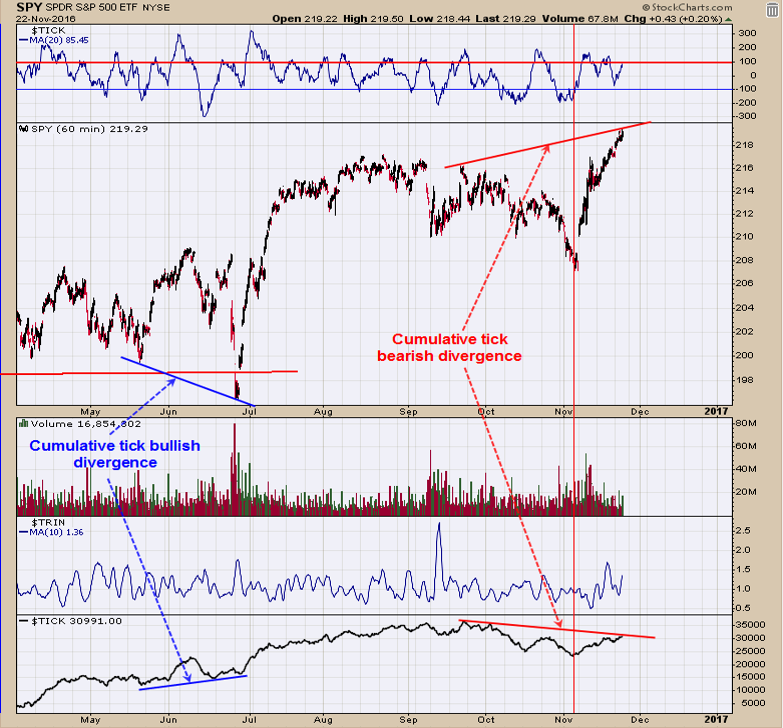
Above is the hourly chart for the SPY with a cumulative tick in the bottom window. A cumulative tick can give warnings of pending tops and bottoms.Going into the low of late June last year, the Cumulative tick produced a positive divergence and a bullish sign. The SPY has broken to new short short-term and the Cumulative tick is failing to confirm, producing a bearish divergence. It's common for the market to produce tops and bottoms around important events and the next important event is January 20 inaugural for president Trump. Also, round numbers can produce reactions and the Dow Jones is flittering with the 20,000 level. There are bearish signs here but signal is complete.
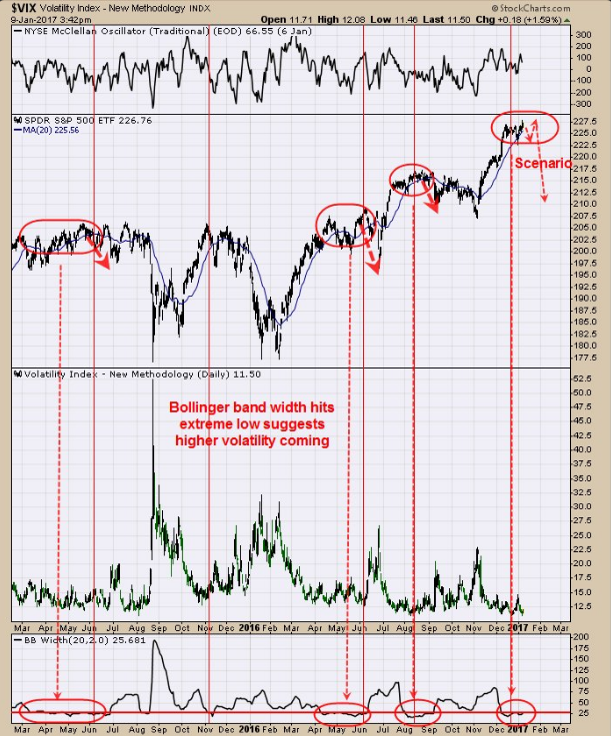
The VIX has been running and staying low for an extended time. The bottom window is the Bollinger Band Width showing the Bollinger Bands was been narrow and low for near a month. The circle in red on the BB Width show previous times this condition occurred and previous times it has lead to a sharp decline. This low reading on the VIX can stay low for a while longer possibility into the inaugural next Friday. We sent out a chart on Friday showing the possible development of a “Three Drives to Top” forming on the QQQ. The Third top of the potential “Three Drives to Top” could come next Friday. Things may change but that is what it looks like what could develop between now and then. When the VIX has stayed low for an extended time, the upside has been limited. Covered 12/30/16 at 2238.83 = gain .46%; Short on 12/29/16 at 2249.26.
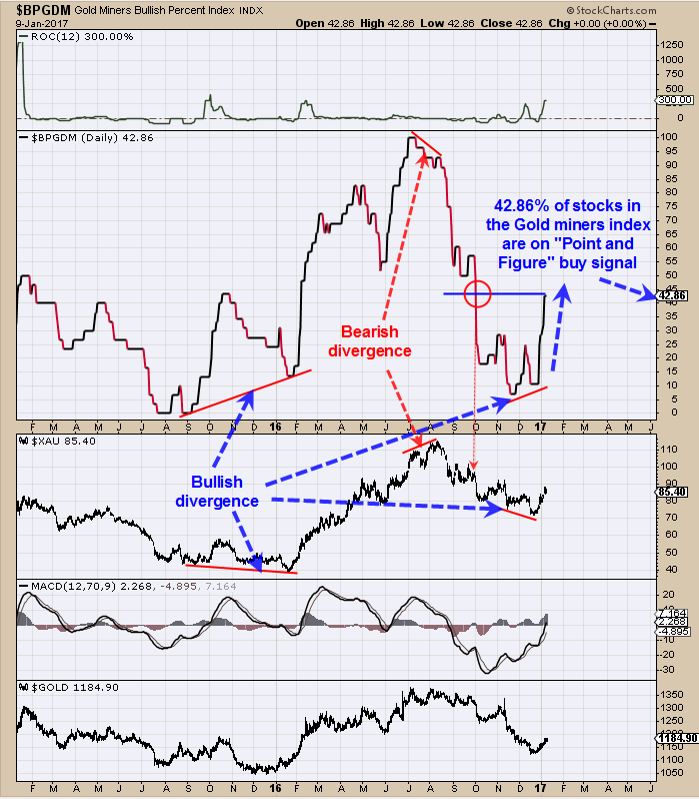
The gold stock market is getting stronger. The chart above is the Bullish Percent index for the Gold Miners index. The Bullish Percent index measures the percentage of stocks in the Gold Miners index that are on “Point and Figure” buy signals. This chart last updated last Friday and that percentage came in at 42.86% and up significantly from the January 1 where is was near 10%. The bullish Percent level is back where it was at First of October when the XAU was near 95.The current level on the XAU is 85.40. We expect the Bullish Percent index to continue to move higher and possible to reach 100% again like it did back in July.In general, GDX should continue to move higher also. Long GDX on 12/28/16 at 20.25.


thanks for sharing