
The U.S. Govt. Financial Disaster Vs. Gold & Silver
The financial disaster taking place at the U.S. Government costs one heck of a lot of gold and silver. I doubt many precious metals investors understand the tremendous amount of gold and silver it takes to service the U.S. debt or supplement the massive budget deficits.
I was actually quite surprised by the results when I compared the calculations. In 2015, the U.S. Federal Government paid $402 billion just to service the interest on its debt. This figure can be found at TreasuryDirect.gov. According to the Federal Reserve Q1 2016 Statistical Release, the U.S. Federal Government spent a total of $4.02 trillion in 2015. Thus, the interest on U.S. debt consumed 10% of the total budget.
While this is not much of a surprise to most precious metals investors, when we compare it to the total value of global gold and silver production, it most certainly is:
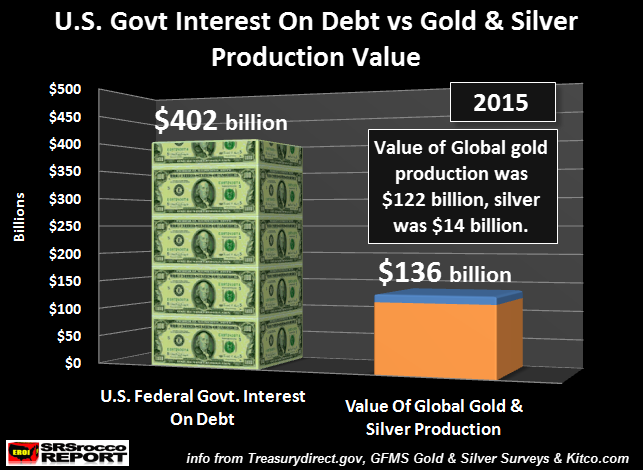
If we multiply the total global gold and silver production in 2015 by the average spot price (of each metal), the total market value of these two precious metals was $136 billion.
NOTE: Actually I used $1,200 for gold even though the average spot price in 2015 was $1,160. Furthermore, I rounded up the price of silver to $16 even though the average spot price was $15.68.
Regardless, the total value of global gold production in 2015 was $122 billion while the total value of silver was $14 billion. Which means, the U.S. Federal Govt. could purchase three times the global gold and silver production in 2015, just to pay the interest on its debt.
Just think about that for a minute. The U.S. Govt finance cost of its debt in 2015 would be able to purchase three years worth of global gold and silver production.
Let’s look at it another way. Total global gold production in 2015 was 101.5 million oz (Moz), while total global silver production was 877 Moz (source: GFMS Gold & Silver Surveys). Thus, the U.S. Federal Govt interest expense in 2015 would purchase 304.5 Moz of gold and 2.6 billion oz of silver.
Let’s put that into perspective. The United States Treasury supposedly holds 8,133 metric tons of gold in its official reserves (again, supposedly… haha). However, 304.5 Moz of gold equals 9,471 metric tons.
What the U.S. Federal Govt paid in just its interest expense of $402 billion in 2015, would purchase more gold in one year than its entire official gold reserves. Furthermore, we can’t forget about the 2.6 billion oz of silver.
According to my article, How High Will Silver’s Value Increase Compared To Gold During The Next Crash?, I stated that the total available amount of physical silver investment in the world (bars and coins) was estimated to be 2.5 billion oz. So, if we include the additional 2.6 billion oz of silver that could also be purchased (along with the all the gold), the U.S. Federal Govt could acquire more silver in one year, greater than the total amount of silver investment stockpiles in the world.
This reveals just how insane the financial situation in the U.S. Federal Government has become.
And… its even much worse when we include the U.S. annual budget deficits.
Take A Look At How Much Gold & Silver The U.S. Federal Govt. Deficits Could Purchase
According to the Federal Reserve Q1 2016 Statistical Report, the U.S. Govt budget deficits totaled $4.2 trillion for the past five years (2011 to 2015). If we applied the same gold and silver values for 2015 to the five-year U.S. budget deficits, this would be the result:
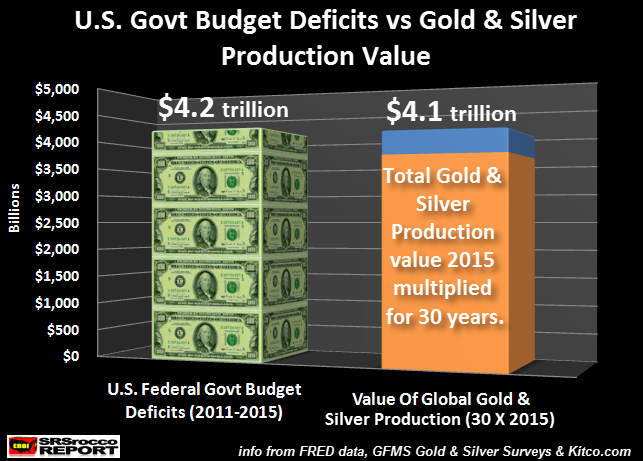
The total amount of U.S. Govt budget deficits from 2011-2015 would purchase 30 times the amount of global gold and silver production in 2015. This turns out to be one hell of a lot of gold and silver. How much?
Gold & Silver Production To Equal $4.2 trillion in Budget Deficits
Gold Production of 101.5 Moz X 30 = 3.04 billion oz
Silver Production of 877 Moz X 30 = 26.3 billion oz
Just to supplement the U.S. Govt deficits for the past five years, the amount would purchase 3 billion oz of gold and 26.3 billion oz of silver. For example, here is my chart from my article linked above on the total official physical global gold and silver investment stockpiles:
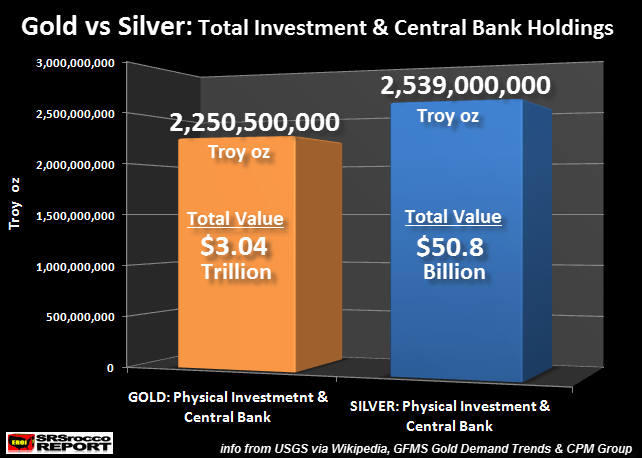
According to the official sources, the world has approximately $3.04 trillion in Central Bank and private gold investment stockpiles in the world. The value of the 2.25 billion oz of gold is higher in this chart than shown in my figures above because this was based on a much higher gold price of $1,350 this year than the figure of $1,200 for 2015.
Regardless, the total sum of U.S. Budget deficits over the past five years could purchase ALL of the known Central Bank and private gold investment holdings in the world. Furthermore, we also have to include the additional 26.3 billion oz of silver the U.S. Govt could purchase from the remaining funds to supplement its 2011-2015 budget deficits.
Amazingly, this would nearly equal all the cumulative world silver production since 1950:
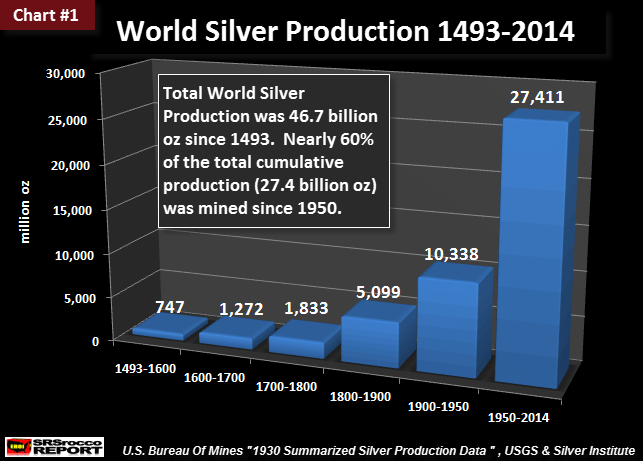
This is the first chart of a total of 48 charts in my THE SILVER CHART REPORT. From 1950 to 2014, the world produced a total of 27.4 billion oz of silver. This turns out to be more than half of all known global silver production to date.
So, the $4.2 trillion in funds to supplement the U.S. budget deficits from 2011 to 2015 would purchase all known Central Bank and private gold investment stockpiles as well as all the global silver production since 1950.
This is how completely insane the U.S. Federal Govt financial situation has become. Now we hear from Fed Chairman Janet Yellen that the Federal Reserve may start to buy stocks. While the Fed has more than likely been propping up the U.S. Stock Markets in private, they are now publicly stating they are considering buying U.S. stocks.
This is a sign that we are at the END GAME of the Greatest Financial Ponzi Scheme in history. While many investors will see this as a green light to BUY STOCKS, instead they should be acquiring physical gold and silver hand over fist.
Lastly, to give you an idea just how insane our $402 billion of annual interest expense is, let’s look at the following figures below:
2015 U.S. Govt Outlays
Food Assistance = $104 billion
Education = $70 billion
Housing & Community = $63 billion
Internal Affairs = $41 billion
Energy & Environment = $39 billion
Unemployment = $36 billion
Transportation = $26 billion
Total = $379 billion
If we total all the U.S. Federal Govt outlays above from Food Assistance to Transportation, it equaled $379 billion in 2015. The U.S. Govt forked out more money just to service its debt last year than it did in all eight government sectors shown above.
Anyone investing in U.S. Treasuries for the long-term, you really need to get your head examined.
With the upcoming collapse of the U.S. and global oil industries, it would be wise for investors to consider increasing their allocation of physical gold and silver. Holding ones wealth in most Stocks, Bonds and Real Estate in the future will likely turn out to be the worst investment strategy ever.
Disclosure: None.


