
The Subprime U.S. Economy: Disintegrating Due To Subprime Auto, Housing, Bond & Energy Debt
The U.S. financial system continues to disintegrate even though most Americans hardly notice. The system is being gutted from the inside out… much the same way a chronic disease weakens a patience even before any symptoms are felt. However, we are already experiencing painful symptoms as U.S. economic indicators continue to weaken.
Here are just a few of the recent headlines:
Energy Giant Schlumberger Fires Another 8,000 As “Market Conditions Worsen” in Q2
The Financial System Is Breaking Down At An Unimaginable Pace
Potential Crisis Triggers Continue To Pile Up In 2016
Just In Time—–Big Wall Street Housing Investors Cashing-Out On Housing Bubble 2.0
Corporate Bond Defaults Hit Highest Rate Since Financial Crisis
These are just some of the recent headlines pointing to BIG TROUBLE AHEAD. However, the U.S. financial system is in dire shape due to the SUBPRIMING of the entire economy. Today, anyone can purchase a car for little or nothing down and finance it for 84 months. The U.S. housing market is also in the same predicament.
According to the article, Are We Heading for Another Housing Crisis?, published on May 12th this year:
While the economy and home prices have both rebounded, some people have expressed concern we are headed for a repeat housing bubble. As of January 2016, home prices were rising at a rate twice that of inflation, according to the S&P/Case-Shiller U.S. National Home Price Index.
What’s more, Fannie Mae and Freddie Mac have unveiled programs to allow first-time homebuyers to make a purchase with only 3 percent down. Plus, some lenders are using alternate credit scores, which may make loans available to those who can’t get one under conventional credit scoring methods.
So, here we are heading down the same path as we did prior to the 2008 U.S. Investment Banking and Housing collapse. However, this time around its both a Subprime Auto & Housing problem. But, that is just part of the Subprime mess.
As most of you already know, many of the world’s sovereign bonds have negative yields. According to the article, The Financial System Is Breaking Down At An Unimaginable Pace:
In February 2015, the total amount of negative-yielding debt in the world was ‘only’ $3.6 trillion.
A year later in February 2016 it had nearly doubled to $7 trillion.
Now, just five months later, it has nearly doubled again to $13 trillion, up from $11.7 trillion just over two weeks ago.
Think about that: the total sum of negative-yielding debt in the world has increased in the last sixteen days alone by an amount that’s larger than the entire GDP of Russia.
Just like subprime mortgage bonds from ten years ago, these bonds are also toxic securities, since many of are issued by bankrupt governments (like Japan).
Instead of paying subprime home buyers to borrow money, investors are now paying subprime governments.
And just like the build-up to the 2008 subprime crisis, investors are snapping up today’s subprime bonds with frightening enthusiasm.
To see total world negative-yielding debt doubling to $13 trillion in just the past six months is aBLINKING RED LIGHT.
So, not only do we have Subprime Auto & Housing… we also have to include Subprime Govt Bonds. While U.S. Treasuries and bonds are not yet negative-yielding, I believe it is just a matter of time.
As we can see, the U.S. is now becoming a massive SUBPRIME ECONOMY. Unfortunately, it gets much worse. The factor that most analysts have not yet factored into the subprime disaster is energy.
I would like to remind my readers and new followers that it takes energy to run the Auto, Housing & Bond markets. Yes, it takes the burning of energy to allow the global bond markets to function. Basically, Treasuries and Bonds are nothing more than claims on future economic activity. My sympathy goes out to anyone holding onto 20-30 year bonds until maturity. I highly doubt these bonds will ever make it to maturity.
That being said, let’s look at the catastrophe taking place in the U.S. Subprime Energy Industry.
U.S. Shale Oil Companies Saddled With Debt Up To Their Eyeballs
I discussed the big trouble with the U.S. Shale Energy Industry in my recent interview with Dan at Future Money Trends. If you haven’t yet checked it out, I highly recommend it:
During the interview I spoke about the following chart below. These are some of the top U.S. Shale oil companies. I included Chevron, not because it is a large shale oil producer, but because it is one of the three major oil companies in the United States:
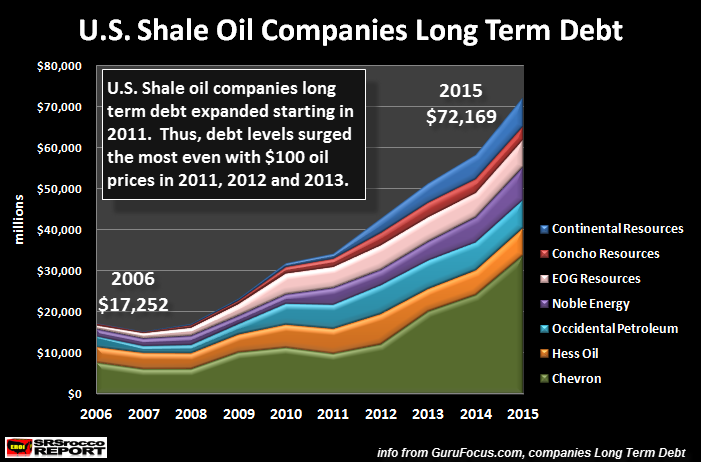
In 2006, these seven U.S. oil companies held $17.2 billion in combined long-term debt. However, by 2015… this ballooned to $72.1 billion. Basically, their debt increased four times in a decade. Now, the interesting thing to understand about this chart is that their long-term debt really started to increase in 2011. Why is this significant?
Because, the price of U.S. oil (West Texas Crude) was nearly $100 for 2011, 2012 and 2013. Which means, the high oil price did nothing to help these companies pay down their debt. Rather, their long-term debt more than doubled in just the past four years.
I hope anyone reading this will realize, SHALE OIL IS SUBPRIME ENERGY that really wasn’t economic unless we had zero interest rates and monetary printing. Even though the U.S. Shale Oil Industry brought on a lot of oil in the past decade, they really didn’t make any money… they just saddled their balance sheets with debt.
Let’s take a look at the most recent data from the top four shale oil fields in the United States. According to the U.S. EIA Drilling Productivity Report released on July 18, the Bakken and Eagle Ford shale oil fields are estimated to suffer large declines in August:
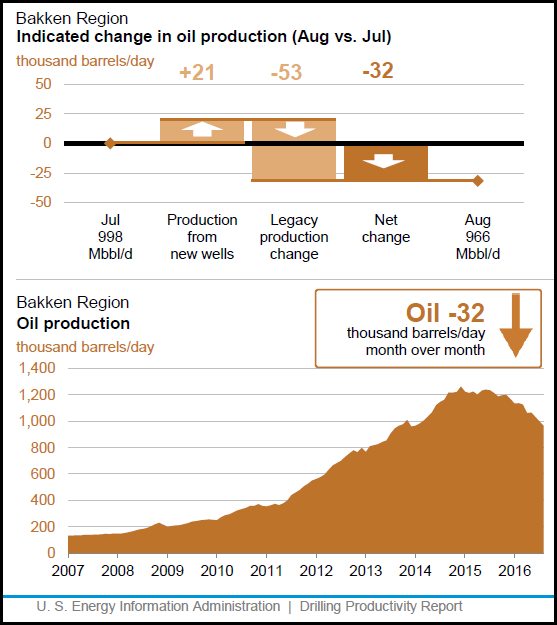
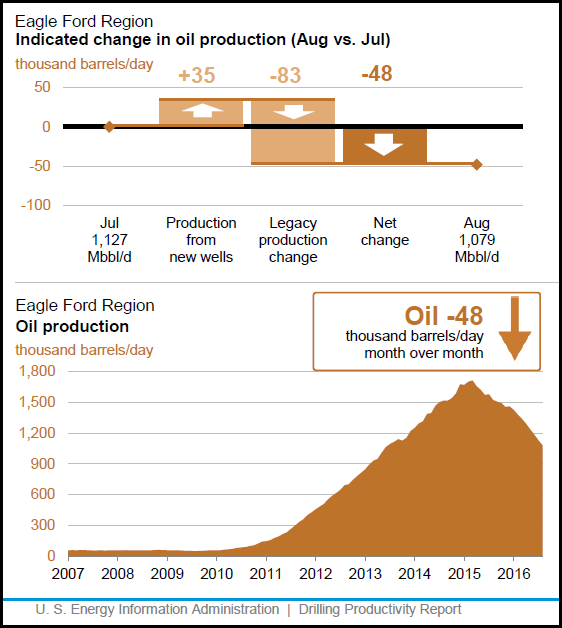
The EIA forecasts that the Bakken and Eagle Ford will lose 80,000 barrels per day in just August. These are BIG NUMBERS. If we look at the actual production figures for the top four shale oil fields, here is the result:
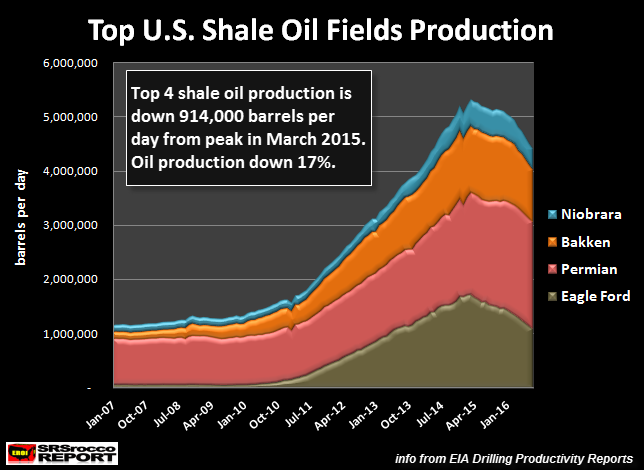
Oil production from the top four shale oil fields has declined 914,000 barrels per day (bd) since the peak in March 2015. This translates to a 17% decline in oil production from these four fields in just 16 months. However, the impact on the U.S. economy is even worse when we look at the figures on a monthly and annual basis.
This next chart shows the combined loss of oil production from these top four shale oil fields based upon the minimum production from Nov 2014 to Nov 2015. Let me explain. In Nov 2014, these shale fields produced 5,027,000 bd, peaked in March 2015 at 5,304,000 bd and then fell back to 5,106,000 bd in Nov 2015. So between Nov 2014 & Nov 2015, these fields produced a minimum of 5,067,000 barrels per day.
In August, the Bakken, Eagle Ford, Niobrara & Permian oil fields will be producing approximately 4,390,000 barrels per day. This is a 676,000 barrel per day decline from the minimum production these four fields produced for a year during that Nov 2014-2015 time period.
The reason why I decided to do it this way is to show that these four fields produced at least 5,067,000 barrels per day for an entire year. To show the decline from the high peak is disingenuous because it was only for a brief one month period. This means, these top four fields will lose 20.3 million barrels of oil in a month and a stunning 247 million barrels in a year:
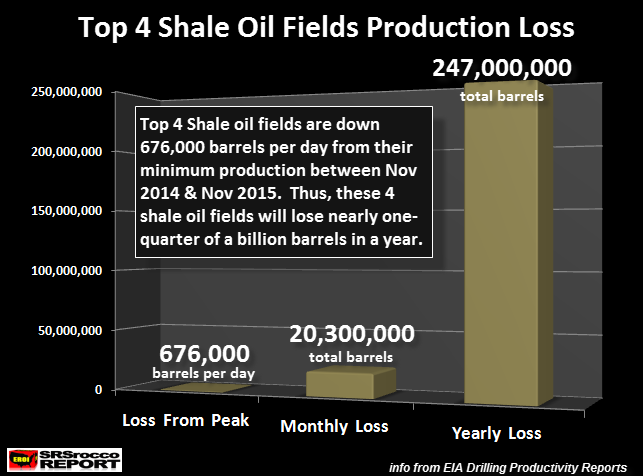
However, it will be much worse than this going forward as U.S. Shale oil production continues to decline. How bad will it be? Well, if these companies received $50 a barrel for oil, it turns out to be a loss of $13.7 billion in a year. But, as I stated, it will be worse as oil production continues to decline.
I published this chart in a previous article, but it’s important to see again:
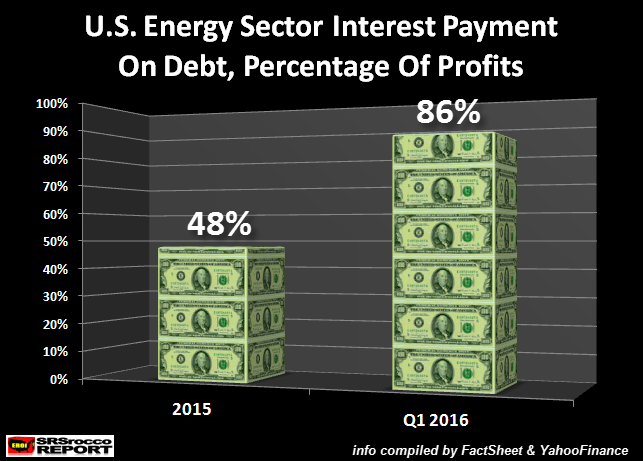
The U.S. Energy Sector is saddled with $370 billion in debt. In 2015, the U.S. Energy Sector paid 48% of their operating profits just to pay the interest on their debt. This ballooned to 86% in Q1 2016 when the oil price fell to $33. If the oil price remains between $40-$50, the U.S. Energy Sector will likely have to fork out 60-70% of its operating income just to service its debt in 2016.
And of course… IT’S EVEN WORSE THAN THAT… LOL. We must remember, for most of 2015, the top shale oil fields were producing 676,000 barrels per day more than they will be this year. Thus, they will have less revenues due to falling oil production.
So, the billion dollar question is this… how will the U.S. Energy Sector survive with low oil prices and falling production???
Welcome to SUBPRIME USA.
Unfortunately, the coming collapse of the U.S. economic and financial system will be orders of magnitude greater than what took place in 2008. Why? Because we just had a subprime housing market in 2008, whereas the entire U.S. economy today is SUBPRIME…. Subprime Auto, Housing, Bonds & Energy.
Lastly, while some precious metals investors have become a bit frustrated by the low gold and silver prices or the ongoing manipulation of the markets by the Fed and Central Banks, the current system is not sustainable. The doubling of world debt with negative yielding debt in the past six months is a bad sign indeed.
Owning physical gold and silver will provide a lot more options during the next economic and financial collapse than most of the paper assets 99% of the world is invested.
Disclosure: None.


I think you have to have a little cash to buy new cars. And there is still massive demand for negative debt. It is pretty clever when you can get investors to pay down government debt. Of course, the upside is that governments can stimulate a little bit with the wiggle room. Strange system and very hurtful to main street except for this potential stimulus, but they are muddling through. Government bonds are like gold, a collateral for derivatives: www.talkmarkets.com/.../central-bank-victory-and-negative-bond-rates
Gary... interesting comment. However, I would not use surplus funds to buy a new car. When the system finally cracks, there will be a huge glut of new and semi-new cars at a huge discount.
How are investors paying down debt?? U.S. debt is now $19.4 trillion. How is that heading lower? Maybe you can clarify what you mean.
Lastly, Government #Bonds are like gold until expensive oil production declines. Cheap #oil production peaked several years ago, now we are waiting for the peak of expensive oil. Actually, if we don't see tens of trillions of Helicopter money dumped on the market shortly, expensive oil production may have already peaked.
Government bonds are #DEBT. The world is full of debt up to their eyeballs. Without growing energy production, this debt will not be paid back. #Gold and #silver are two of the best assets to own going forward.
Steve
Hi Steve. Thanks for responding to my comment. You may be right about the cars.
Investors are paying down debt in Europe and Japan. As even you said, we have not turned negative yet.
As far as government bonds relationship with energy, I confess I am not an expert about that at all. I do think that energy is not the only game in town, and wasn't it funded by junk instead of pristine treasuries? I think the demand for bonds is more in the interest rate derivatives market, which is much larger than the energy derivatives market. That is why I don't think energy can destroy everything. But I could be wrong.
Yes, government bonds are debt, but they are gold. They are, in fact, of higher rating than gold itself when used as collateral for interest rate derivatives. In fact, they are in short supply, and demand exceeds supply. Just FYI.
I wrote about that a couple of times. Here is one showing a lot of bond hoarding, new gold hoarding, going on: www.talkmarkets.com/.../a-whole-lot-of-gold-hoarding-going-on
Gary,
I appreciate the thoughtful reply. While bonds presently have a higher rating than gold, I don't believe this will be true several years down the road. Furthermore, there are a shortage of bonds, because of the massive #liquidity injections by #CentralBanks. Bonds can be in short supply when Central Banks print money to buy them.
Actually, the #Fed and Central Banks are running out of assets to buy. This is why several analysts believe the next Central Bank BULLET will be outright #HelicopterMoney.
Lastly, the production of energy is different than comparing outstanding #EnergyDerivatives to the Interest Rate Derivative Market. While it's true that the Interest Rate Derivative Market totally overwhelms anything else by several orders of magnitude, I would like to kindly remind you financial instruments are worthless without the burning of energy. Burning #energy translates to economic activity. Profitable economic activity translates to a functioning financial system.
When U.S. and global expensive oil production declines in earnest, this will cause a serious dislocation in the Financial System that will result in collapse. Unfortunately, this will be a depressionary collapse we never come out of.
Of course.. this is my humble opinion.
Steve
Thanks Steve. I just think there are trillions of dollars of bonds committed as collateral for derivatives. Even without #QE, bond yields have gone down. Seriously, this is the new normal and it presents problems. We will be in low rate territory for decades unless some other factor comes into play.