
The Stock Market’s Most Popular ETF Puts In A Long-Term ‘Spinning Top’
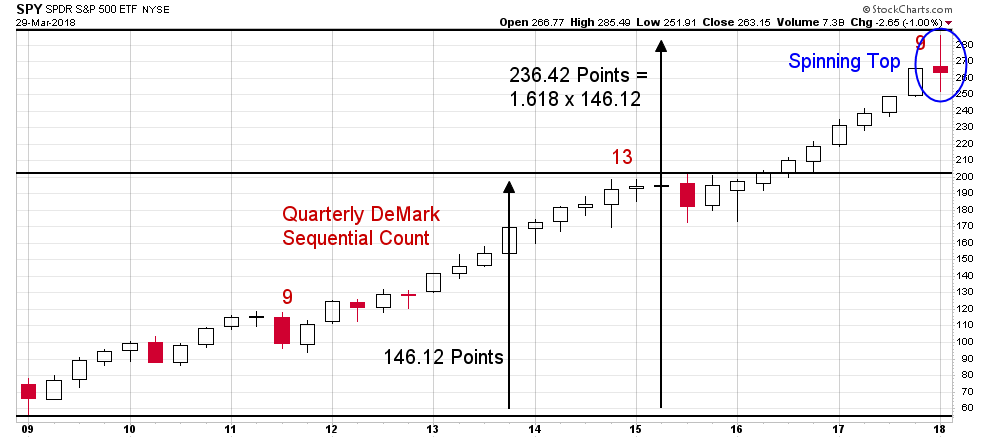
I have been calculating DeMark Sequential signals by hand for over a decade now. It’s one tool in my technical toolbox that I have found to be very helpful in identifying major trend changes. Last year I noticed we were approaching a long-term DeMark Sequential sell signal on the SPY ETF. That quarterly 9-13-9 sell signal triggered during the fourth quarter and to paraphrase Tom DeMark, ‘the 9-13-9 is one of the most powerful signals there is.’
Stocks obviously continued higher for a bit afterwards nearly touching the 1.618 Fibonacci Extension target noted in the chart below. They reversed, however, in February and by quarter end the ETF had completed a “spinning top” candlestick. To quote StockCharts.com, “After a long advance or long white candlestick [in this case both are applicable], a spinning top indicates weakness among the bulls and a potential change or interruption in trend.”
Taken all together, the technicals appear to have lined up suggesting there is a good probability we are already in the midst of a major reversal at this point. In fact, it’s nearly the exact opposite of the bullish technical setup we saw back in 2009.
(Click on image to enlarge)
Disclosure: Information in “The Felder Report” (TFR), including all the information on the Felder Report website, comes from independent sources believed reliable but accuracy is not ...
more

