
The S&P 500 In The Week When Turkey Happened
The second full week of August 2018 was mostly uneventful for the S&P 500 (Index: SPX). From Monday, 6 August 2018 through Thursday, 9 August 2018, the index teased the possibility of topping its previous high record of 2,872.87 that was set back on 26 January 2018.
And then, for lack of a better description, Turkey happened, and the S&P 500 retreated by 0.7% on Friday, 10 August 2018 to close the week at 2,833.28.
(Click on image to enlarge)
To be fair, Turkey didn't so much happen as it finally started catching up to what has been happening to the country under the hands of its increasingly dictatorial ruler over the past five years, where the collapse of its currency on Friday, 10 August 2018 sent shock waves through the world's equity and emerging markets. Emerging markets, because of an elevated risk of contagion not seen since Greece's economy imploded earlier in the decade. Equity markets, because of the exposure of financial institutions to that contagion.
That's a short summary of the view from 30,000 feet. Here are the main market-moving headlines we noted for Week 2 of August 2018.
Monday, 6 August 2018
- Oil rises after OPEC sources say Saudi crude output fell
- S&P buybacks brisk in second-quarter, may set another record: S&P Dow Jones
- Wall Street closes higher as strong earnings cheer investors
Tuesday, 7 August 2018
- Oil rises as U.S. sanctions on Iran stir supply worries
- Amazon and Microsoft nudge S&P 500 closer to record high
Wednesday, 8 August 2018
- Oil drops on China import data, weighing on equities
- S&P 500, Dow edge down as oil prices, trade worries weigh
Thursday, 9 August 2018
- Oil slips as trade worries weigh on market
- Fed's Evans sees one or two more rate hikes in 2018 as reasonable
- S&P 500, Dow end lower with energy, financials; Tesla falls
Friday, 10 August 2018
Looking at the bigger picture, Barry Ritholtz found that there were more negatives than positives in the week's economy and markets news.
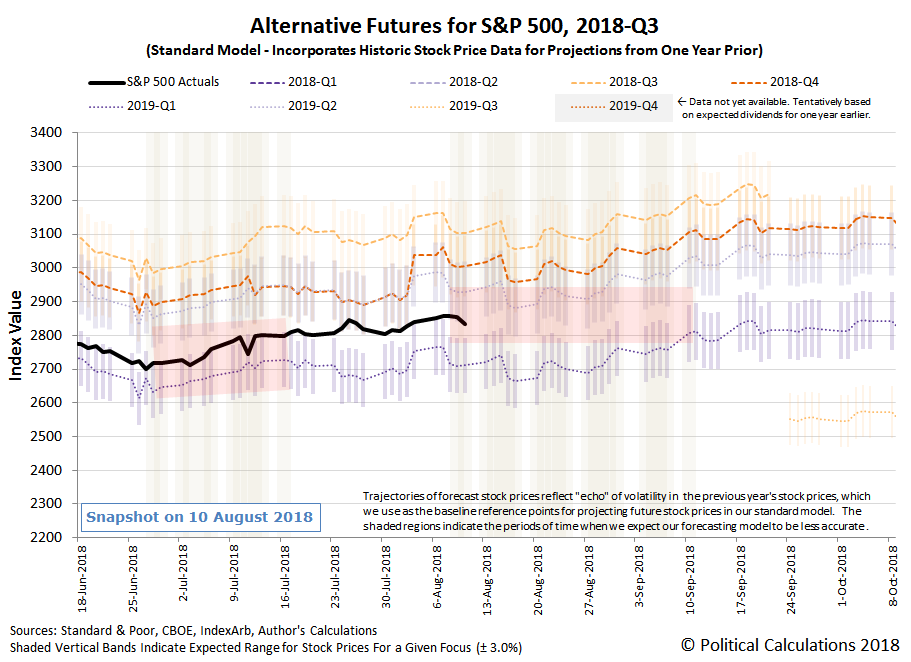
Sharp-eyed readers will note that we've added one of our redzone forecasts to the spaghetti forecast chart we use to anticipate the future for the S&P 500 based on our dividend futures-based model, which we do to account in part for the volatility in the historic stock prices that we use as the base reference points from which we project future stock prices.
Here, we're assuming that investors will continue to split their forward-looking focus between 2018-Q4 and 2019-Q1 in setting stock prices in the period from 8 August 2018 to 11 September 2018, but will tend to more heavily weight that more distant future quarter in setting their expectations. We've also drawn the new redzone forecast more narrowly than we did earlier in the quarter, so that it reflects the historically typical level of volatility that we've seen in stock prices during the past seven decades.
Given current market circumstances, that new redzone forecast may be drawn too narrowly, where we may see the trajectory of the S&P 500 move outside of that range without necessarily confirming a true shift in the forward-looking focus of investors. On the plus side, if that does happen, we'll have a nice visual confirmation that stock prices are experiencing extreme volatility.
Disclaimer: Materials that are published by Political Calculations can provide visitors with free information and insights regarding the incentives created by the laws and policies described. ...
more

