
The S&P 500 Falls Back From New Records In Week 2 Of November 2017
On Wednesday, November 8, the S&P 500 (SPY) closed at an all time new record high closing value of 2594.38, before going on to fall back a bit to end the week at 2582.30.
Along the way, the index set an all new intraday high on Tuesday, November 7 of 2597.02. The new highs marked a now one-year long rally for stock prices in the United States, coinciding with the positive market reaction to the surprise defeat of Hillary Clinton in the 2016 presidential elections and the end of expectations that failing Obama-era economic and fiscal policies would continue.
But for us, that wasn't the most interesting thing that happened during a fairly uneventful week. Just over two months ago, we identified a specific range in which we expected that the S&P 500 would fall during each day of the last two months, provided that investors would largely remain focused on the distant future quarter of 2018-Q2 in making their investment decisions. And then it happened, where we've opted to mark the occasion by showing the trajectory of the S&P 500 over the span of 2017-Q3 and 2017-Q4 through the close of trading on 10 November 2017 in the following chart.
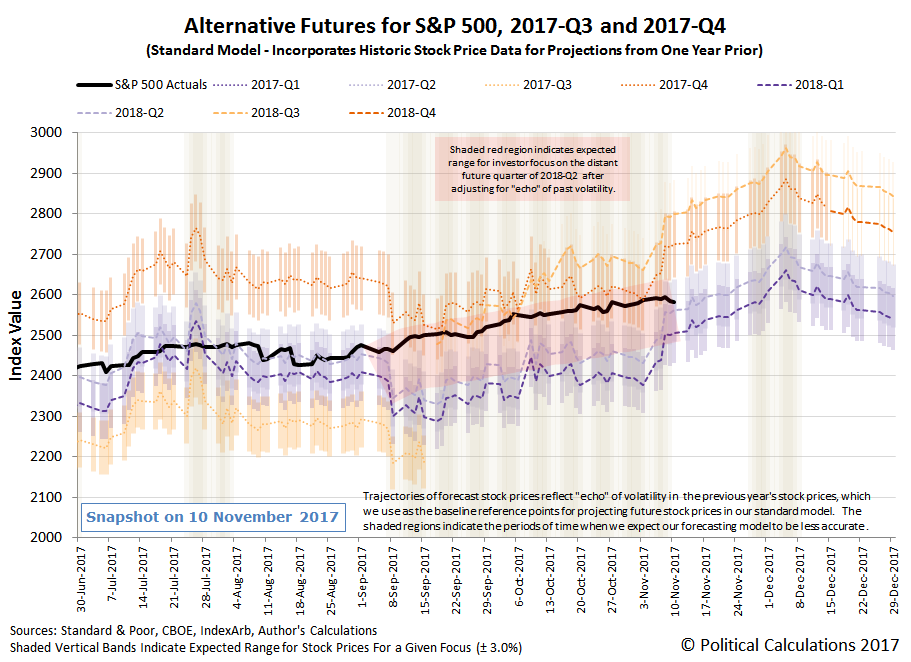
The thing that prompted us to make the unique forecast was the need to have to cope with echo effect of the past volatility of stock prices on our dividend futures-based model for an extended period of time, which arises from our use of historic stock prices from 13 months, 12 months and 1 month earlier as the base reference points from which we project future stock prices. There was, of course, no guarantee that investors would maintain their focus on 2018-Q2 during all that time, nor was their any guarantee that the U.S. stock market wouldn't be affected by a major noise event either in a new outburst of current-day volatility, but our assumptions remained valid and our forecasting results speak for themselves.
Let's next take a closer look at where we are in the current quarter of 2017-Q4.

The key to understanding what our model is communicating is to know how far ahead in time investors are focusing their forward-looking attention. In these spaghetti charts, once you've identified which point of time in the future investors are looking, our model can put you within 3% of the indicated trajectory associated with that future quarter, where currently, investors continue to appear to be focused on 2018-Q2, which currently coincides with what will likely be the timing of the Fed's first rate hike in 2018, following an almost certain lock for a rate hike to be announced in December 2017.
We said earlier that Week 2 of November 2017 was largely uneventful for the S&P 500, that may be an understatement.
Disclosure: None.


