
The Short Term Uptrend Continues - Tuesday, July 10
The Short-Term Trend
The short-term uptrend continues. I am watching this uptrend a bit more closely than usual because the SPX is right up against resistance.
Small Caps were a bit weak today, while the rest of the market looked okay.
Maybe there is news I haven't seen yet, or it could be that the small-cap group has rallied far enough, and now the money is flowing out of these leaders and into the laggard large caps which were impacted by the trade war news.
Also, the US Dollar looks like it is ready to rest a bit, and the small have been rallying in correlation with the US Dollar strength.
(Click on image to enlarge)

This chart has filled a tiny price gap from last month. Now, what happens?
I am watching its 50 and 200-day moving averages, and letting the index tell its own story based on whether the prices remains above or breaks below these trend lines.
The health of the SOXX ETF will tell me a lot about the direction of the general market because I don't believe the market can consistently climb to new highs without this index leading.
(Click on image to enlarge)

My guess is that the US stock market is testing the upper range of a base and that it will continue to test the upper and lower boundaries of the range until the midterm elections.
However, it is just a guess, and my money is going to follow the actual indexes (within cautious reason).
So while the index is above this support level shown below, I will assume higher prices in the future. If it breaks down below support, then I change strategies and prepare for less positive outcomes.
(Click on image to enlarge)

Here is a broader look at the same index with a 40-week average. While above this average, assume higher prices. A close below, and it is time to reduce stock market exposure.
(Click on image to enlarge)

Rates
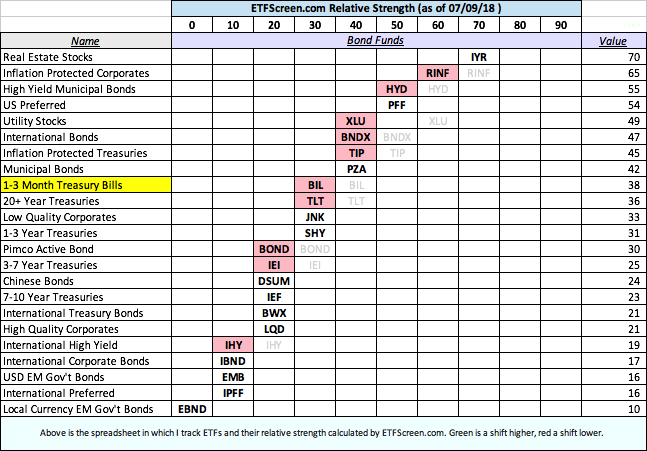
What is this spreadsheet telling us?
I see a lot of red which is an indication that money is flowing into stock funds again, and out of the income-related ETFs shown below.
Also, these funds are mostly skewed left on the spreadsheet which means they are underperformers, and that they are probably not the best place to have money at the moment.
The non-stock portion of my accounts are in T-Bills at the moment. The ETF is BIL shown below. T-Bills are very stable, and they do well while the Federal Reserve is raising rates. Also, I was whipsawed a bit while invested in RINF, so I decided to just simplify with T-Bills.
(Click on image to enlarge)
Here is an interesting chart. It overlays the gold miners with TIPs. The two were quite nicely correlated until late 2017. Now, TIPs are climbing higher while the miners are not moving at all.
Will the miners start to follow TIPs?
(Click on image to enlarge)

Speaking of TIPs, this chart shows the price trying to rally to new highs but then struggling. What is going on?
The fixed income market is confusing at the moment. There is a whiff of inflation (as there often is late in a bull market of stocks), and with inflation, you would expect TIPs to do well.
They are trying to rally, but they are stuck. So far anyway. My guess is that this recent inflation we are seeing is just a temporary countertrend.
(Click on image to enlarge)

What scares me though is that we usually think of bonds moving up or down in price based mostly on the influences of inflation. But now the federal government is running huge deficits. I worry that we may start to see bond investors demand higher yields to compensate for the higher risk associated with these deficits. That is really scary.
Disclaimer: I am not a registered investment advisor. My comments above reflect my view of the market, and what I am doing with my accounts. The analysis is not a recommendation to buy, ...
more

