The Real Longest Bull Market Ever
We’ve read or heard a number of erroneous reports lately claiming that we’re about to set the record for the longest S&P 500 bull market on record. Since the S&P 500 made its last bull market closing high on January 26th, the bull market actually stopped aging on that date, and we’ve essentially been in limbo since. (You can read more on this topic in this post we published late last week.)
But while the bull market for the S&P 500 really isn’t the longest on record, another major US index just set the record for its longest bull market ever.
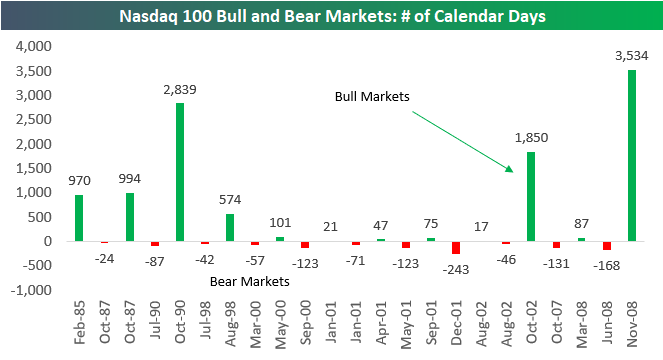
The Nasdaq 100’s current bull market has lasted 3,534 calendar days (from 11/20/08 through its most recent high on 7/25/18). As shown in the chart below, that’s easily its longest on record since the index began in 1985.
(Click on image to enlarge)

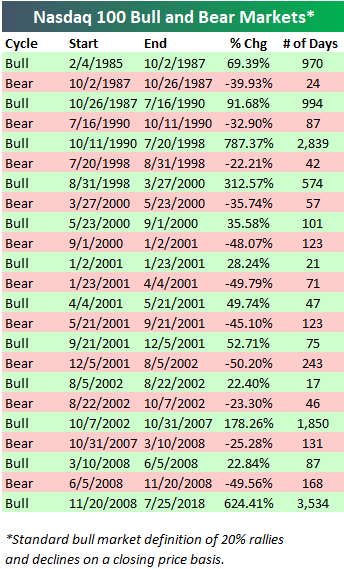
While the current Nasdaq 100 bull is easily the longest on record, it’s still not the strongest. The 1990s bull that ran from October 1990 through July 1998 saw the index gain 787.37% before it eventually fell into a short bear market in July/August ’98. The current bull for the Nasdaq has only seen a gain of 624.41%.
(Click on image to enlarge)

In addition to being in its longest bull market ever, the Nasdaq 100 is also in the midst of another record streak.
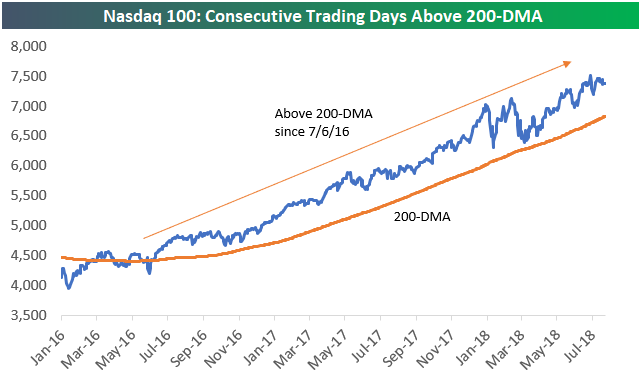
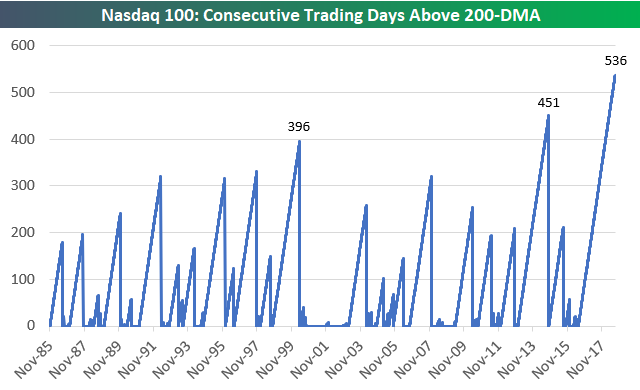
As shown below, the index has now closed above its 200-day moving average for a record 536 trading days dating back to July 6th, 2016. That’s well above the 396-trading day streak that ended in May 2000 and the 451-trading day streak that ended in October 2014.
(Click on image to enlarge)

(Click on image to enlarge)

See Bespoke’s most actionable stock market research with a Bespoke Premium free trial.


