The Power Of Price Spikes On Intraday Charts
Last week ended on a very positive note for those who follow and trade filtered price spikes.
What is a filtered price spike? In short, I scan pre-market, and post-market trading hours’ price charts of SPY, QQQ, IWM, GLD, and GDX for a very special odd tick in the market which creates a spike on the chart.
These spikes could be to the upside or downside, does not matter. What they tell me is the direction which the market (market makers) are going to try and move the market in then next 48 hours.
As long as you can trade 1x, 2x or 3x ETFs, futures, Binary options, spread betting, or CFD’s, then you can take full advantage of these quick and powerful moves.
These spikes generally are not huge percent movers, typically range between 0.25% – 1.1%, but they are highly accurate and when leverage is used like trading futures you can pocket $250- $1500 quickly.
I have found price spikes to work exceptionally well in predicting market-moving news before it takes place like Brexit and Friday’s Fed decision.
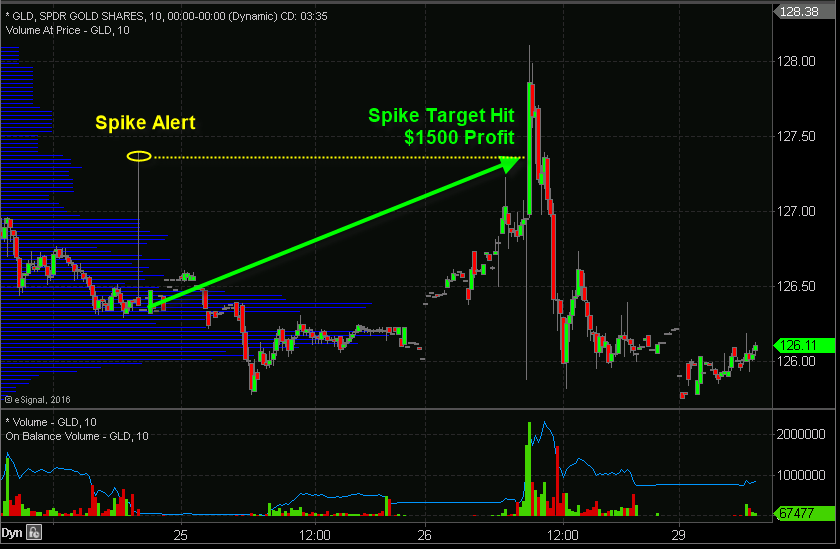
Below you will see a chart of GLD (gold) which flashed us a with a buy signal 36 hours before gold shot up in price post the Fed decision.
(Click on image to enlarge)

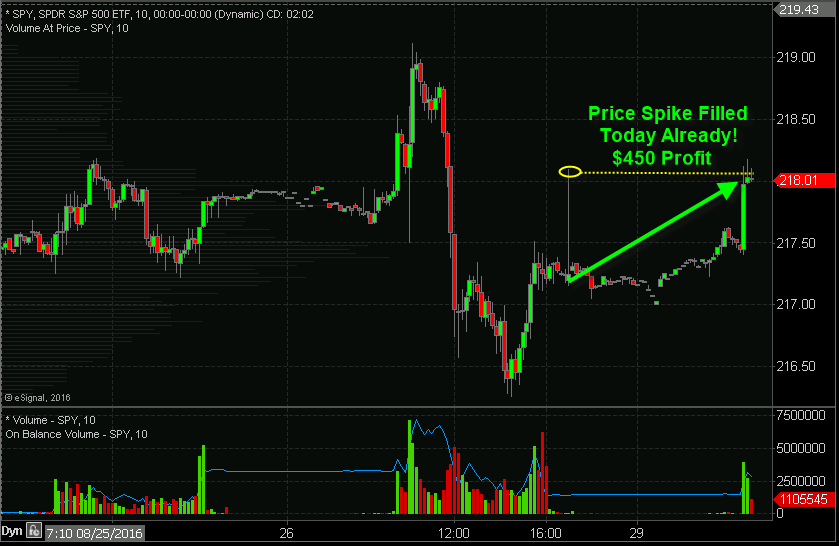
This week (Monday Aug 29th) SPY Spike and Target Hit
On Friday after the market closed I saw a spike up on the SPY chart. You can see what happened the next trading session once the market opened – Market rallied and the spike was filled for a quick $450 profit.
(Click on image to enlarge)

Disclosure: If you want to know where the market is headed each day and week, well in advance then be sure to join my ...
more


