
The National Savings Identity, Crowding-Out, And Apocalypse Predicted
Consider this prognostication from 2011:
Americans face the most predictable economic crisis in this nation’s history. Absent reform, the panic ahead is no longer a question of if, but rather when. A deterioration of confidence by investors in government’s ability to pay its bills will drive interest rates up, increasing borrowing costs for government, small businesses and families alike. A vicious cycle of debt will compound upon itself; the available exit options once the crisis hits will be limited; and all will involve pain. (p.59)
Writing about the President’s FY2012 budget:
…Autopilot spending will soon crowd out all other priorities in the federal budget, with spending on Medicare, Medicaid, Social Security and interest on the national debt eclipsing all anticipated revenue by 2025. Borrowing and spending by the public sector will crowd out investment and growth in the private sector. … [emphasis added] (p.56)
Those quotes are from Representative Paul Ryan’s FY2012 “Path to Prosperity”.
It is all the more surprising, then, to consider actual data that has come out over the past three years since publication of that document.
First, consider the sources of saving available to the US economy, by reference to the National Savings Identity:
(S-I) + (T-G) ≡ CA
where S and I are private savings and investment, (T-G) is the public sector budget balance, and CA is the current account. Figure 1 shows the evolution of these series, all expressed as a share of nominal GDP (note that I have omitted the statistical discrepancy for the sake of clarity).
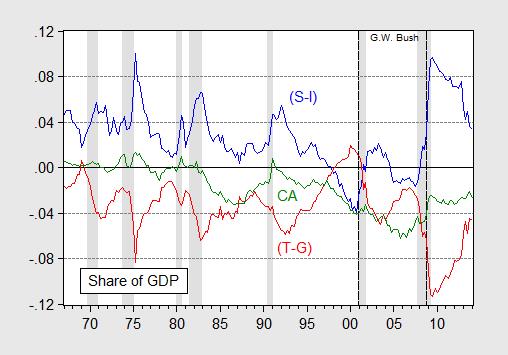
Figure 1: Private sector net savings (S-I) (blue), public sector net savings, or budget balance (T-G) (red), and current account (CA) (green), all as a share of GDP. NBER defined recession dates shaded gray. Source: BEA, 2014Q2 advance release, NBER, and author’s calculations.
Notice the drastic reduction in the public sector deficit, even prior to the implementation of the sequester in March 2013. The current account balance has improved substantially since the onset of the Great Recession — in line with a conventional macro model that relies on a marginal propensity to import — although it has stabilized at about 2.5% of GDP.
The identity is merely that — an identity, useful for accounting purposes. However, it does make clear that the US is not borrowing as much from the rest of the world as it was during the G.W. Bush years (peaking at about 6.2% annualized in a couple quarters). That is, the rest-of-the-world has thus far been happy to finance the US aggregate saving needs (as well as that of the Federal government — more on that in a bit).
The improvement in the public sector balance, particularly the Federal one, is quite marked if one abstracts from cyclical effects. Figure 2 presents (by fiscal year) the actual Federal budget balance and the one abstracting from automatic stabilizers, normalized by the potential GDP.
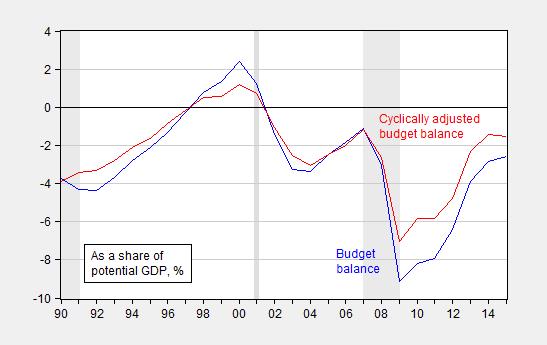
Figure 2: Federal budget balance (blue) and balance without automatic stabilizers (red), as percent of potential GDP (%), by fiscal year. NBER defined recession dates shaded gray. Source: CBO, Budget and Economic Outlook, February 2014, and NBER.
Hence one should not be too surprised that the apocalyptic vision regarding interest rate trajectories held by Representative Ryan in his various “Paths” have not come to pass. In fact real borrowing costs for the US government have remained quite low by historical standards.[1]
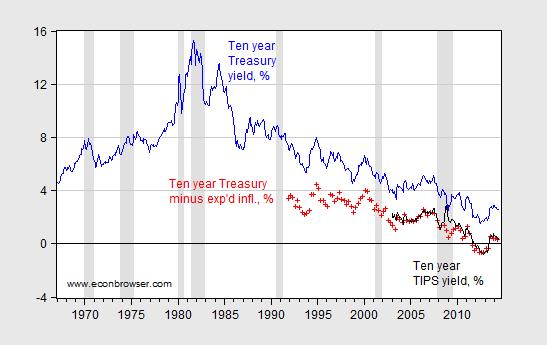
Figure 3: Ten year constant maturity Treasury yields (blue), ten year constant maturity yields minus ten year (median) expected inflation (red +), and ten year constant maturity TIPS (black). NBER defined recession dates shaded gray. Source: Federal Reserve via FRED, Survey of Professional Forecasters, and author’s calculations.
Substantial (portfolio) crowding out of private investment as feared by Representative Ryan is unlikely to occur if interest rates do not rise appreciably (relative to the counterfactual); and in fact if investment depends on output, then decreased government spending and hence government deficits might actual yield greater crowding out than the counterfactual (see this post for discussion).
Is it all the Fed’s doing? Fed holdings of Treasury debt (all maturities) were about 18.4% of total publicly held Treasury debt, as of March 2014. Compare this against the previous peak of 17.3% in March 2003, and 24% in June 1974. So Fed purchases are part of the story, but not by any means all of the story. In fact, one might point to another factor as being even more important, namely foreign demand. Thus far the foreign sector (both private and public) seems quite content to continue acquiring US Treasurys, despite the best efforts of some policymakers to drive up the risk premium; see also [2]. Figure 4 depicts foreign holdings of long term US Treasurys.
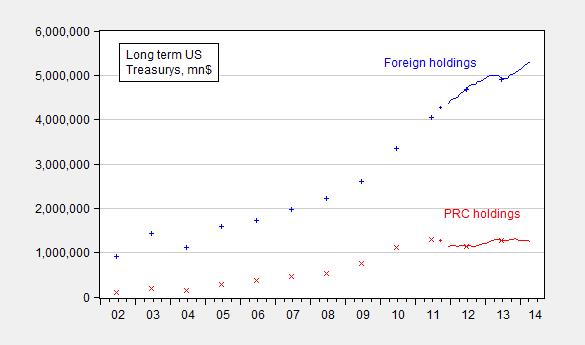
Figure 4: Foreign holdings of long term US Treasurys (blue) and holdings of the People’s Republic of China (red). +,x indicate benchmark data, line indicates TIC monthly estimates. Source: Treasury.
Looking at levels of holdings in dollars can be misleading, given the increasing size of US Federal debt. However, normalizing doesn’t yield a substantially different perspective. The ratio of long term US Treasurys to total publicly held Federal debt has held fairly constant over the past several years.
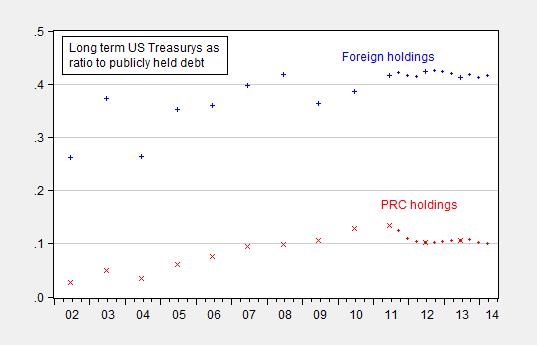
Figure 5: Foreign holdings of long term US Treasurys (blue) and holdings of the People’s Republic of China (red), all divided by Federal government publicly held debt (both short and long term). +,x indicate benchmark data, line indicates TIC monthly estimates. Source: Treasury, FRED, and author’s calculations.
One reason why Treasurys have been so favored during the global financial crisis and aftermath was the safe haven aspect of US Federal debt — not only in terms of default risk, but also in terms of geopolitical risk. To the extent that the VIX proxies for these factors — including geopolitical ones like Ukraine/Russia, one should expect (1) an obvious inverse correlation and (2) an abatement of the demand once risk dissipates. On (1), consider Figure 6.
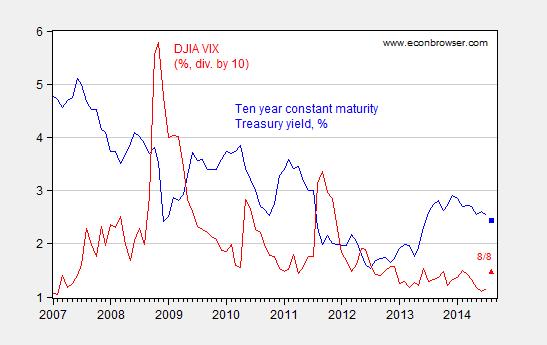
Figure 6: Ten year constant maturity Treasury yield (blue) and DJIA VIX, divided by 10 (red). Observations for August are for August 8. Source: FRED.
I think there is something to the inverse correlation, in addition to the clear downward trend in the nominal ten year government yield in the background. But it clearly isn’t everything.
Regarding (2), it’s not obvious to me that there is going to be a sustained drop in uncertainty; if that is the case, elevated demand for US Treasury’s may be a persistent condition. That in turn suggests that the idea that long term funding costs for the Federal government (including in real) reverting to long run norms might not occur for some time. By the way, these arguments abstract away from the discussion of secular stagnation, as modeled by Eggertsson and Mehrotra (2014), among others. Secular stagnation merely adds onto the reasons why one should expect low Treasury borrowing costs going into the future.
What are the ramifications of an outcome where Federal funding costs are diminished for an extended period of time? One implication is the growth of government debt-to-GDP is less pronounced than, for instance, what was implied in the CBO scenarios used in Kitchen-Chinn (2011) (see discussion in this post). The urgency for rapid fiscal consolidation is thus commensurately reduced.
Disclosure: None.


