
The Nasdaq Triggers Another Breadth Warning
Over the past few weeks, the Nasdaq has triggered a total of five Hindenburg Omens. As I wrote back in November, the last time the Nasdaq saw a cluster of signals like this, “The ‘Hindenburg Omen’ was developed by Jim Miekka as a warning of a stock market crash. While it’s not very effective in this regard it can be very useful in assessing the overall strength of an uptrend.”
This indicator is only triggered when there is widening dispersion within the major indexes during an uptrend. Technically, for a Hindenburg Omen to be triggered it requires the index to have a positive 50-day rate of change and the number of new highs and lows both surpass 2.8% of all issues within it. When we see a growing number of these signals triggered it points to a consistent rise of inconsistency within the individual components of the index, a sign that longer-term breadth is waning.
Over the past 20 years, there have only been a handful of occasions when we have seen the Nasdaq trigger so many Hindenburg Omens in a short period of time. In fact, there have only been three separate occasions when the index triggered 8 signals in less than four week’s time. After each of these, the index suffered a correction if not a full-blown bear market. At 5 currently we’re obviously not there yet but this may be something worth keeping an eye on as 5 was enough for the top in March of 2000.
(Click on image to enlarge)

What’s more, if we look at the number of signals triggered on both the Nasdaq and the NYSE over the past year we are just coming off the largest cluster since the 2007 peak. The current reading (26) is also greater than that seen at the March 2000 top (20). Of course, the signal in 2015 did not lead to a major market peak as did the prior two signals. However, that doesn’t diminish this indicator’s value as a warning signal – the 2015-2016 market experience was still the most painful in several years.
(Click on image to enlarge)
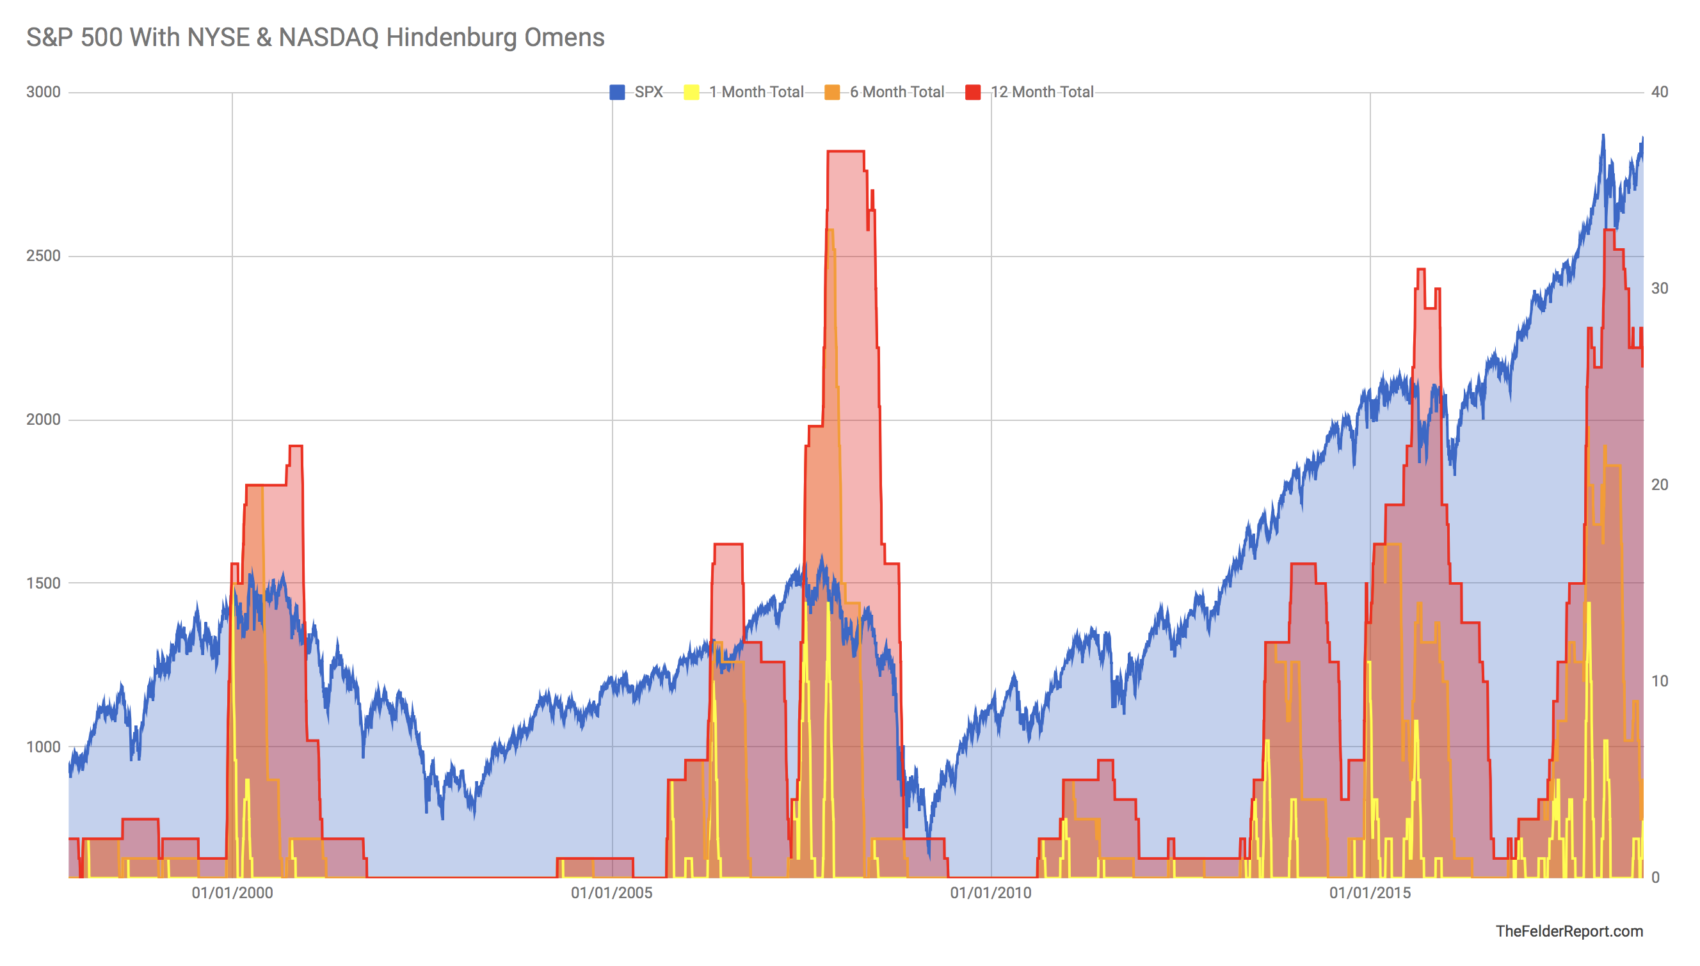
The bottom line is that even while the indexes have risen to test or set new all-time highs the deterioration in breadth under the surface has reached a rare extreme. This is a clear technical sign that the current equity bull market is not nearly as healthy as price alone would indicate. And it should inspire caution among investors for the simple reason it suggests the stock market is especially vulnerable right now to another 2015-2016 experience or something even more significant.
Disclosure: Information in “The Felder Report” (TFR), including all the information on the Felder Report website, comes from independent sources believed reliable but accuracy is not ...
more

