
The Myths Of Stocks For The Long Run – Part XI
<< Read More: Part I – “Buy & Hold” Can Be Hazardous To Your Wealth
<< Read More: Part II – Why Crashes Matter & The Saving Problem
<< Read More: Part III – Valuations & Forward Returns
<< Read More: Part IV – The Math Of Loss
<< Read More: Part V – Choosing The Right Portfolio Benchmark
<< Read More: Part VI – Should You Invest Like Warren Buffett?
<< Read More: Part VII - The Myths Of Stocks For The Long Run
<< Read More: Part VIII - The Myths Of Stocks For The Long Run
<< Read More: Part IX - The Myths Of Stocks For The Long Run
<< Read More: Part X - The Myths Of Stocks For The Long Run
CHAPTER 11 – Portfolio Strategies For The Long-Run
Over the previous 10-chapters of this series, we have discussed many of the fallacies of investing for the long-term. The two biggest of these issues, which impacts performance over time, is the lack of capital to invest and human psychology. As Howard Marks once said:
“I’ve been in this business for over forty-five years now, so I’ve had a lot of experience.In addition, I am not a very emotional person. In fact, almost all the great investors I know are unemotional. If you’re emotional then you’ll buy at the top when everybody is euphoric and prices are high. Also, you’ll sell at the bottom when everybody is depressed and prices are low. You’ll be like everybody else and you will always do the wrong thing at the extremes.”
While the idea of “buy and hold” investing is proselytized by the mainstream media, the reality is that ultimately all investors wind up “buying tops” and “selling bottoms.”
There are numerous “investing legends” who are revered for their investment knowledge and success. While we idolize these individuals for their respective “genius,” we can also save ourselves time and money by learning from their wisdom and their experiences. Their wisdom was NOT inherited, but was birthed out of years of mistakes, miscalculations, and trial-and-error. Most importantly, what separates these individuals from all others is their ability to learn from those mistakes, adapt, and capitalize on that knowledge in the future.
Experience is an expensive commodity to acquire, which is why it is always cheaper to learn from the mistakes of others.
Most importantly, not one of these legendary investors has “buy and hold” as a rule. Yes, they believe in long holding periods, but they also have a healthy respect for valuation, risk and capital preservation. They sell when value is no longer present and/or the risk of capital loss outweighs the potential reward.
There are only a few basic “truths” of investing, and protecting the value of your investment capital is the most important.
In 2010, Brett Arends wrote “The Market Timing Myth” which sets up our discussion for today.
“For years, the investment industry has tried to scare clients into staying fully invested in the stock market at all times, no matter how high stocks go or what’s going on in the economy. ‘You can’t time the market,’ they warn. ‘Studies show that market timing doesn’t work.’
They’ll cite studies showing that over the long-term investors made most of their money from just a handful of big one-day gains. In other words, if you miss those days, you’ll earn bupkis. And as no one can predict when those few, big jumps are going to occur, it’s best to stay fully invested at all times. So just give them your money… lie back, and think of the efficient market hypothesis. You’ll hear this in broker’s offices everywhere. And it sounds very compelling.
There’s just one problem. It’s hooey.
They’re leaving out more than half the story.
And what they’re not telling you makes a real difference to whether you should invest, when and how.”
In this chapter, we will explore three broad and basic strategies for managing a portfolio. These are just examples to explain the concept of managing risk, and we hope it encourages you to explore, learn, and expand your investing knowledge and expertise.
1. Technical – Stock/Bond Swap Using 12-Month Moving Avg.
It is true that you “can’t time the market.”
Importantly, we are not endorsing “market timing” which is specifically being “all in” or “all out” of the market at any given time.
However, having a methodology to “buy” and “sell” investments is the core of investing, hence the very basic rule of investing which is to “buy low and sell high.”
While there are many sophisticated methods of handling risk within a portfolio, even using a basic method of price analysis, such as a moving average, can be a valuable tool over the long-term holding periods. Will such a method ALWAYS be right? Absolutely not. However, will such a method keep you from losing large amounts of capital? Absolutely.
For example, the chart below shows a simple 12-month moving average study. What becomes clear is that using a basic form of price analysis can provide useful identification of periods when portfolio risk should be REDUCED.
Importantly, I did not say risk should be eliminated; just reduced.
(Click on image to enlarge)
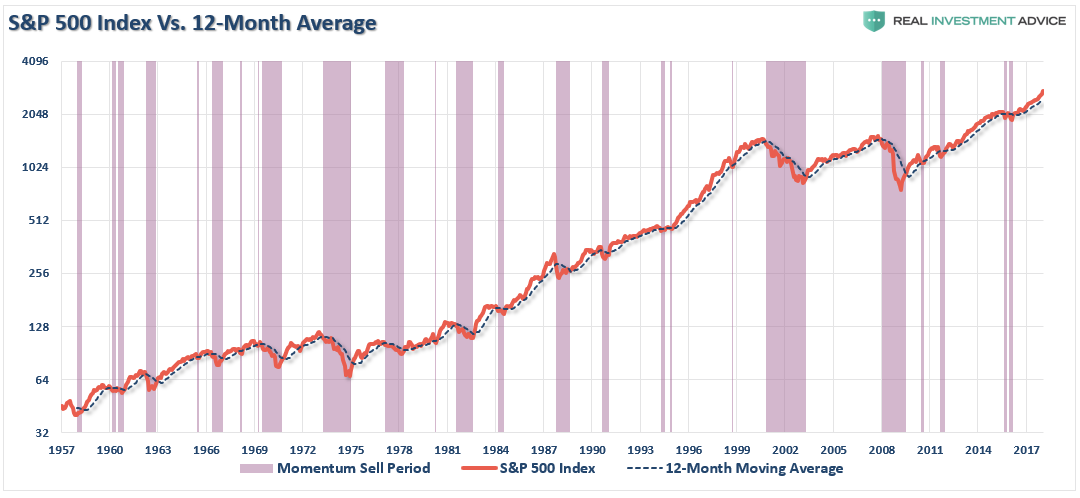
Again, no one is suggesting, or stating, that such signals mean going 100% to cash. The overarching premise is that when “sell signals” are given, it is often time where some action should be taken to manage portfolio risk.
Let’s review an example of this strategy at work.
In 1988, Bob was 35 years old, had saved up a $100,000 nest egg and decided to invest it in the S&P 500 index. He added $625/month to the index every month and never touched it. When Bob retires at 65, he wants to maintain his current $75,000 lifestyle. We will assume he can generate 3% a year in retirement on his nest egg.
The chart below shows the difference between two identical accounts. Each started at $100,000, each had $625/month in additions, and both were adjusted for inflation and total returns. The purple line shows the amount of money required, inflation-adjusted, to provide a $75,000 per year retirement income to Bob at a 3% yield. The only difference between the two accounts (blue and gold) is that one went to “cash” when the S&P 500 broke the 12-month moving average and avoided major losses of capital multiple times.
(Click on image to enlarge)
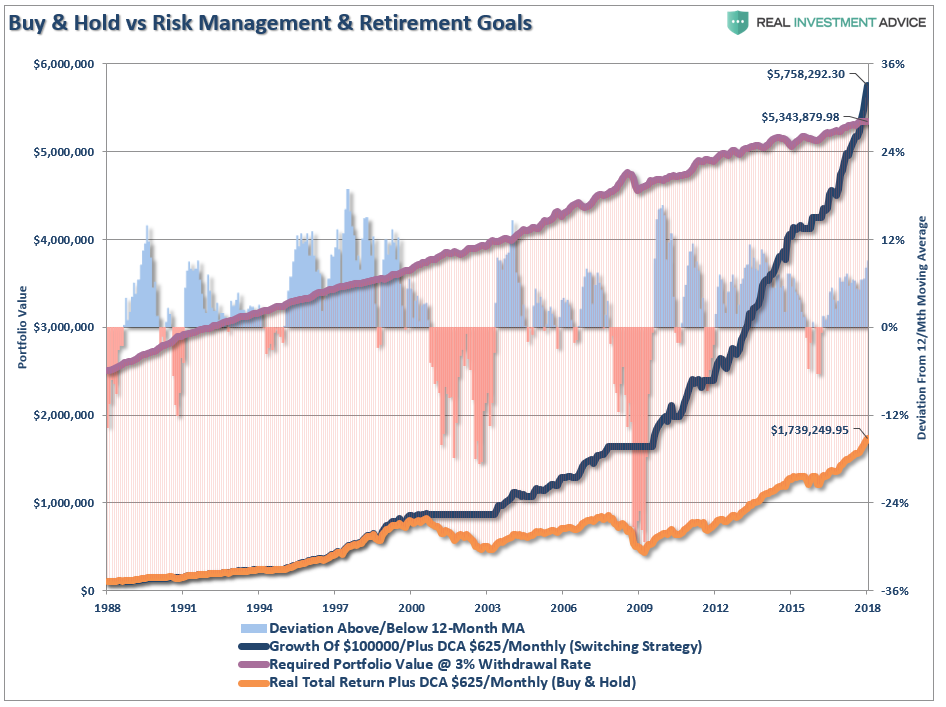
Yes, “buy and holding” an index, or a basket of stocks, will certainly make you money given enough time but will leave you far short of your investment goals.
There is a clear advantage of adhering to a risk management protocol for portfolios over time. The problem, as we discussed previously, is that most individuals, even if they have a strategy, fail to follow it because of “short-termism.”
This type of risk management strategy doesn’t just apply to investing in an index but also to individual stocks.
Whenever we discuss “risk management” in the context of long-term investing there is almost always a comment made that:
“If someone had just bought Apple when they first went public, they would have made lots of money.”
First of all, this is an extremely poor argument. While Apple (AAPL) is a great company today, it struggled for nearly two decades before their rebirth as a “consumer product” company with the advent of the iPhone. Few individuals remained loyal to Apple during the “go-go” 1990’s when other tech companies far outpaced its return.
Secondly, while it is nostalgic to talk about buying Apple, or Amazon (AMZN), when they first went public, the reality is that for every big winner today, there are many that went bankrupt like Enron, Netscape, Global Crossing, etc. For every big winner, there is a trail of bodies along the way. As any skilled investor will tell you, “skill” is only part of the equation, “luck” and “timing” are the others.
But let’s assume we did buy Apple and applied a 3-month/9-month moving average crossover buy/sell strategy to determine when to buy, sell or hold Apple. (This is for example purposes only and focuses solely on capital appreciation.)
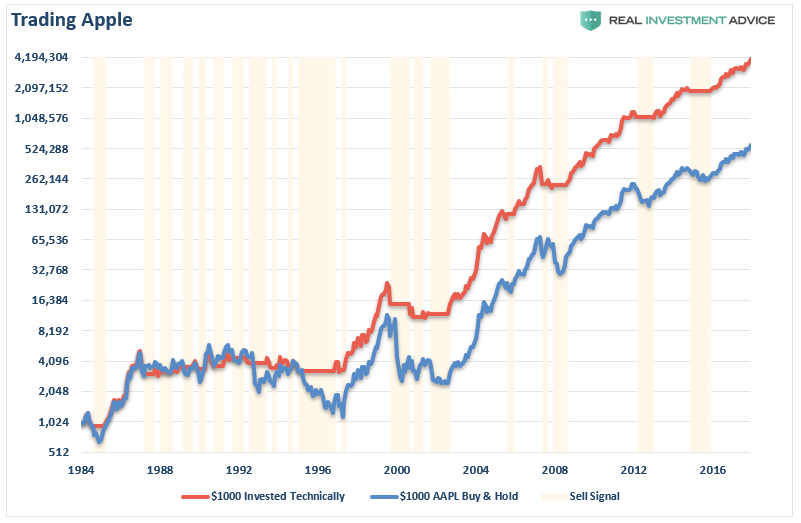
While it is true that a $1000 investment in 1984 on a “buy and hold” basis would have grown impressively to more than $500,000 currently, the buy/sell strategy would have grown that same portfolio to more than $4 million. The point here is simple, much more wealth is created by avoiding periods of capital destruction.
It’s just math.
2. Fundamental and Technicals
“But I am a fundamental investor and not a trader. “
So are we.
Just to reiterate – so are we.
We believe that “fundamental value” is what drives long-term returns in portfolios over time. However, what does an investor do when markets are excessively overvalued and “fundamental value” becomes a rare commodity?
This is where technical analysis can enhance a fundamental strategy.
To explain this with an example, we are going to use Shiller’s CAPE ratio. This ratio, which is the price of the market divided by the 10-year average of trailing earnings, has been widely discussed in the media, and often dismissed during bull market advances, because of it does not timely signal turning points in the market.
The chart below tells a simple story. When valuations are elevated (red), forward returns have been low and market corrections have been exceptionally deep. When valuations are cheap (green), investors have been handsomely rewarded for taking on investment risk.
(Click on image to enlarge)

With valuations currently on par with those on the eve of the Great Depression and only bettered by the late 1990’s tech boom, it should not be surprising that many are ringing alarm bells about potentially low rates of return in the future. It is not just CAPE, but a host of other measures including price/sales, Tobin’s Q, and Equity-Q are sending the same message.
The problem with fundamental measures, as shown with CAPE, is that they can remain elevated for years before a correction, or a “mean reverting” event, occurs. It is because of these long periods where valuation indicators “appear” to be wrong where investors dismiss them and chase market returns instead.
Such has always had an unhappy ending.
The chart below marries a technical “buy/sell” rule to provide “timeliness” to the slow-moving CAPE fundamental indicator shown above.
- Blue Line – Real S&P 500 index with a 24-month (2-year) moving average.
- Lower Chart – Shiller’s CAPE ratio: Red = CAPE > 20, Grey = CAPE > 10 & < 20, Green = CAPE < 10
- Blue Shaded Bars – “Sell Signal” when CAPE > 20 AND market closes below 24-month MA
- Purple Shaded Bars – “Sell Signal” when S&P 500 closes below the 24-month MA
(Click on image to enlarge)
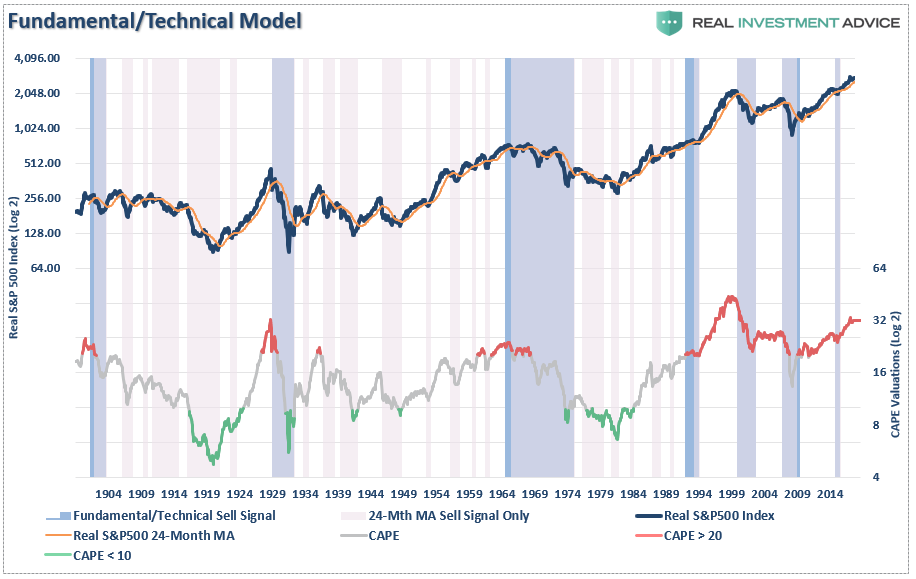
What jumps out immediately is that the combination of both the fundamental and technical signal certainly kept investors from getting trapped in the most severe historical market corrections. But by establishing some “rules”around the signal, we can vastly improve potential returns. The chart below shows $1000 invested in four different strategies.
- $1000 into a “buy and hold” investment strategy.
- $1000 into a valuation ONLY strategy that is long the S&P 500 until CAPE exceeds 20x earnings and then goes to cash until CAPE is below 10x earnings.
- $1000 into a technical switching strategy that switches from the S&P 500 to cash based solely on the break of the 24-month moving average. (Buy S&P 500 when price moves above the 24-month moving average, Sell when below. Based on the close of the last day of the trading month.)
- $1000 into a fundamental/technical strategy.
- Buy and hold the S&P 500 when valuations are less than 10x earnings.
- Sell when CAPE is above 20x earnings AND the S&P 500 breaks below the 24-month moving average.
- During the mean reversion process (20x to 10x CAPE) the portfolio utilizes the technical strategy only.
- When valuations are below 10x earnings, buy and hold the S&P 500 index.
(Click on image to enlarge)
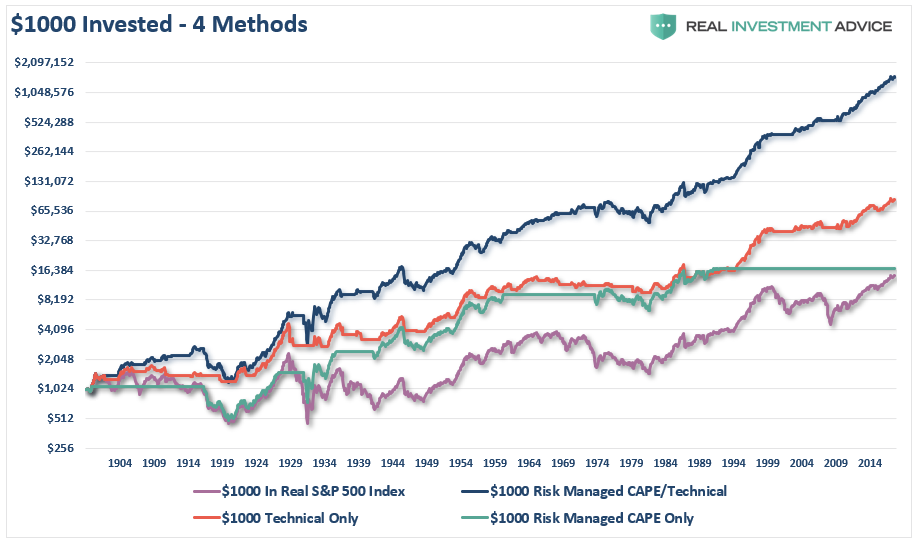
While it is true that a “buy and hold” investment strategy will work over a long enough time frame, every other strategy outperformed it. As we have explained previously, avoiding losses and spending less time “getting back to even” leads to greater investment returns over time.
The problem with CAPE as a portfolio management tool is exposed as well. While an investor using CAPE only would have outperformed the “buy and hold” strategy, they would have been out of the market since the 1990’s.
Clearly, the two best methods for managing portfolio risk, avoiding major drawdowns, and creating wealth over time are the technically driven methods.
Did these models avoid every correction, drawdown, or stumble? Of course, not. Did they underperform the benchmark index in some years because they were “out” of the market? Absolutely.
But over time, the avoidance of the major destruction of capital leads to greater appreciation and attainment of financial goals which is the sole goal and reason why we invest.
3. Options Strategy
There are an infinite number of options strategies that one can deploy to serve all kinds of purposes.We discuss three strategies that involve hedging exposure to the S&P 500. The purpose is to give you a sense of the financial cost, opportunity cost, and loss mitigation benefits that can be attained via options.
Option details in the examples below are not based on current pricing. If you are interested in exploring any or all of these strategies please use current index and options prices.
Elementary Put Hedge
A Put Hedge option strategy is the simplest option hedge one can employ. A put provides its holder a right to sell a security at a given price. For instance, if you own the S&P 500 ETF (SPY) at a price of 100 and want to limit your downside to -10%, you can buy a put with a strike price of 90. If SPY drops below 90, the value of the put will rise dollar-for-dollar with the loss on SPY, thus nullifying any SPY losses beyond 10%.
To help visualize what a return spectrum might look like on a portfolio hedged in this manner consider a simple scenario in which one owns the S&P 500 (SPY) and hedges with SPY options.The following assumptions are used:
- Own 400 shares of SPY at a price of $246.80 per share at the cost of $98,720.
- The holding period is 1 year.
The graph below provides the return profile of the long SPY position (black) and three hedged portfolios for a given range of SPY prices. The example provides three different hedging options to show what under-hedged (2 options),perfectly-hedged (4 options) and over-hedged (8 options) outcomes might look like.
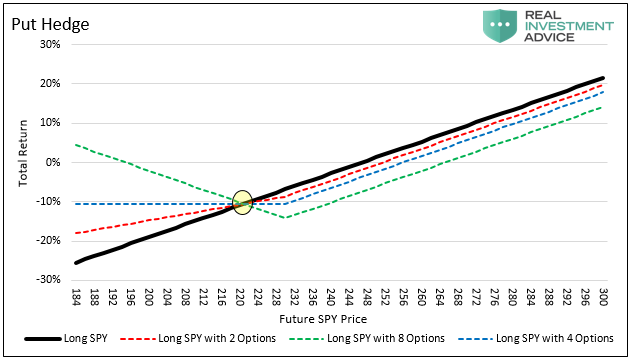
Note the breakeven point (yellow circle) on the hedged portfolios occurs if SPY were to decline 10% to $221 per share. The cost of the options in percentage terms shown on the right side of the breakeven point is the difference in returns between the black line and the dotted lines.
Conversely, the benefit of the options strategies appears in the percentage return differentials to the left of the breakeven point. In this example, we assume the options are held to the expiration date. Changes in other factors such as time to expiration, rising or falling volatility, and intrinsic value will produce results that do not correspond perfectly with the results above at any point in time other than at the expiration date.
Collar
The simple Put Hedge strategy was straightforward as it only involved buying a one-year put option. Like the first strategy, a collar entails holding a security and buying a put to limit the downside risk. However, to reduce the cost of the put option a collar trade requires one also to sell (write) a call option. A call option entitles the buyer/owner to purchase the security at the agreed upon strike price and the seller/writer of the option to sell it to them at the agreed-upon strike price. Because the investor is selling/writing an option, he is receiving payment for selling the option. Incorporating the call option sale in a collar strategy reduces the net cost of the hedge but at the expense of upside returns.
To help visualize what the return spectrum might look like with a collared portfolio that owns the S&P 500 (SPY) and hedges with SPY options, consider the following assumptions:
- Own 400 shares of SPY at a price of $246.80 per share at the cost of $98,720.
- The holding period is 1 year
- Purchase SPY put options with a strike price of $230.
- Sell/write SPY call options with a strike price of $270.
As diagrammed below, a collar strategy puts a collar or limit around gains and losses.
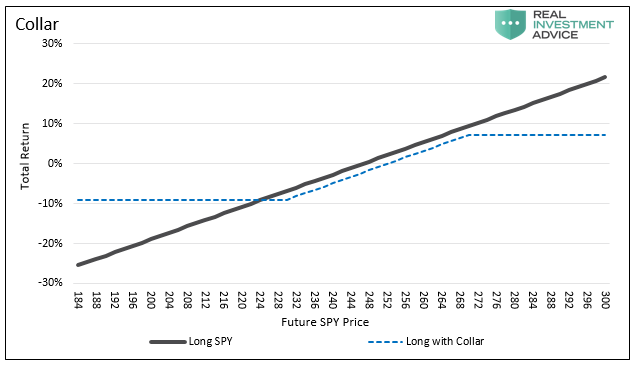
Writing the call option reduces the net hedging cost by $1,550, limits losses to 9% but caps the ability to profit if the market increases by at least 7.21%.
Sptiznagel’s Tail Strategy
Mark Spitznagel is a highly successful hedge fund manager and the author of a book we highly recommend called “The Dao of Capital.” Spitznagel uses Austrian school economic principles and extensive historical data to describe his unique perspectives on investing. In pages 244-248 of the book, he presents an options strategy that served him well in periods like today when valuations foreshadowed significant changes in market risk. The goal of the strategy is not to hedge against small or even moderate losses, as in the first two examples, but to protect and profit from severe tail risks which can destroy wealth like the recent experiences of 2000 and 2008.
Sptiznagel’s strategy hedges a market position with put options expiring in two months. On a monthly basis, he sells the put options and buys new options expiring in two months. The strike price on his options are 30% below current prices. To replicate his strategy and compare it to the ones above we assume the following:
- Own 400 shares of SPY at a price of $246.80 per share at the cost of $98,720.
- The holding period is 1 year.
- Purchase 82 SPY put options (equivalent to .50% of the portfolio value) with a strike price of $175 (30% out of the money). Because the options are 30% out of the money the price of the options are relatively cheap.
- For purposes of this example, new options are purchased when the current options mature every two months (Spitznagel sells and buys new options on a monthly basis).
- We also assume this hedge was already in place for a year resulting in an accrued trade cost of $2,952 (6 *$492) to date.
The graph below highlights the cost-benefit analysis.
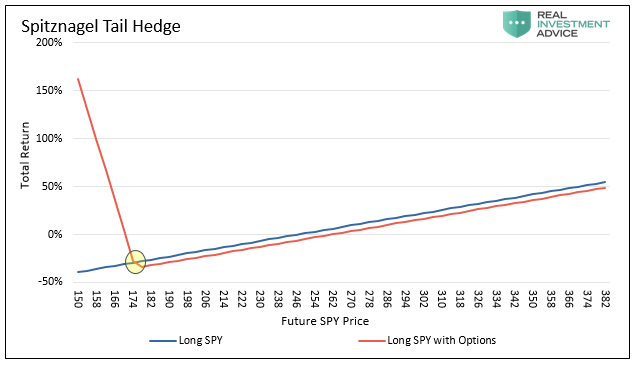
The strategy graphed above looks appealing given the dazzling reward potential, but we stress that the breakeven point on the trade is approximately 30% lower than current prices. While the cost difference to the right of the breakeven point looks relatively small, the axis’s on the graph has a wide range of prices and returns which visually minimizes the approximate 6% annual cost. Similar strategies can be developed whereby one gives up some gains in a severe drawdown in exchange for a lower cost profile.
Cost/Benefit Table
The table below compares the strategies detailed above to give a sense of returns across a wide range of SPY returns.
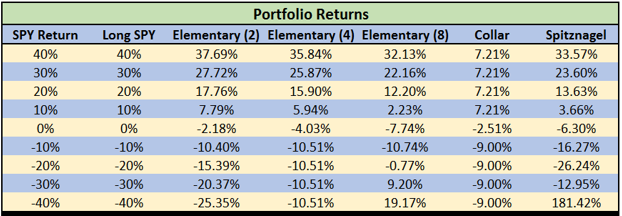
The option strategies in this article are designed for the initial stages of a decline. Pricing of options can rise rapidly as volatility, a key component of options prices, increases. The data shown above could be vastly different in a distressed market environment. These options strategies are just examples. We recommend an investment professional be used to customize options strategies to meet investor’s needs.
15-Rules To Follow
The examples shown above are just a small sampling of the many different portfolio management strategies, techniques, and processes that could be employed. No one strategy is right for everyone, but some strategy is better than no strategy at all.
However, behind every investment strategy, portfolio management discipline and portfolio process should be a guiding set of principals.
It is from Howard Marks’ view on risk management that our own portfolio management rules are derived which drive our investment discipline at Real Investment Advice. While we are currently tagged as “bearish,” due to our views and analysis of economic and fundamental data, we are actually neither bullish or bearish. We follow a very simple set of rules which are the core of our portfolio management philosophy with a focus on capital preservation and long-term “risk-adjusted” returns.
- Cut losers short and let winner’s run. (Be a scale-up buyer into strength.)
- Set goals and be actionable. (Without specific goals, trades become arbitrary and increase overall portfolio risk.)
- Emotionally driven decisions void the investment process. (Buy high/sell low)
- Follow the trend. (80% of portfolio performance is determined by the long-term, monthly, trend. While a “rising tide lifts all boats,” the opposite is also true.)
- Never let a “trading opportunity” turn into a long-term investment. (Refer to rule #1. All initial purchases are “trades,” until your investment thesis is proved correct.)
- An investment discipline does not work if it is not followed.
- “Losing money” is part of the investment process. (If you are not prepared to take losses when they occur, you should not be investing.)
- The odds of success improve greatly when the fundamental analysis is confirmed by the technical price action. (This applies to both bull and bear markets)
- Never, under any circumstances, add to a losing position. (As Paul Tudor Jones once quipped: “Only losers add to losers.”)
- Markets are either “bullish” or “bearish.” During a “bull market” be only long or neutral. During a “bear market”be only neutral or short. (Bull and Bear markets are determined by their long-term trend.)
- When markets are trading at, or near, extremes do the opposite of the “herd.”
- Do more of what works and less of what doesn’t. (Traditional rebalancing takes money from winners and adds it to losers. Rebalance by reducing losers and adding to winners.)
- “Buy” and “Sell” signals are only useful if they are implemented. (Managing a portfolio without a “buy/sell” discipline is designed to fail.)
- Strive to be a .700 “at bat” player. (No strategy works 100% of the time. However, being consistent, controlling errors, and capitalizing on opportunity is what wins games.)
- Manage risk and volatility. (Controlling the variables that lead to investment mistakes is what generates returns as a byproduct.)
How you choose to manage your portfolio is entirely up to you. This is just how we approach managing money for our clients who are approaching retirement and can ill-afford a major loss of investment capital.
Every investment strategy has a consequence and will lose money from time to time. The only difference is the amount of the loss, what causes it, and the amount of time lost in reaching your investing goals.
With that in mind, we leave you with the prescient words of Brett Arends:
“Can’t time the market? It was clear as a bell that investors should have gotten out of stocks in 1929, in the mid-1960s, and 10 years ago. Anyone who followed the numbers would have avoided the disaster of the 1929 crash, the 1970s or the past lost decade on Wall Street. Why didn’t more people do so? Doubtless, they all had their reasons. But I wonder how many stayed fully invested because their brokers told them ‘You can’t time the market.’”
Disclosure: The information contained in this article should not be construed as financial or investment advice on any subject matter. Real Investment Advice is expressly disclaims all liability in ...
more

