
The Mother Of All Breakouts Still In Play
Short-Term View
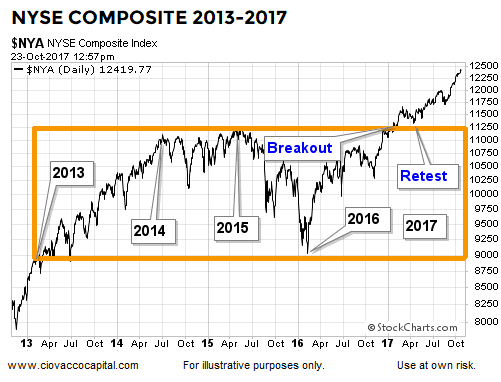
The NYSE Composite stock index traded near the bottom of the orange box shown below in 2013 and 2016. The index visited the top of the box in 2014, 2015, and again in late 2016, before breaking out. A successful retest of the breakout occurred earlier in 2017.
Fractals Are Key
Since markets move in fractals, we can apply the same principles to patterns that form on short-term charts to those that appear on long-term charts, even very long-term charts. From stockcharts.com:
Rectangles represent a trading range that pits the bulls against the bears. As the price nears support, buyers step in and push the price higher. As the price nears resistance, bears take over and force the price lower. One group (bulls or bears) will exhaust itself and a winner will emerge when there is a breakout. Only until the price breaks above resistance or below support will it be clear which group has won the battle.
Did The 1987 Crash Come Out Of Left Field?
As the years have gone by, many have come to believe the crash that occurred on Black Monday, October 19, 1987, was a true “we had no warning at all” black swan. This week’s video looks at the facts that were in place the Friday before Black Monday, allowing us to better understand the odds of something similar happening in 2017.
The Very Long-Term View
When we view the NYSE Composite Stock Index from 60,000 feet, we see a long-term period of indecisiveness that occurred between 1966 and 1982. After a successful break above resistance and a successful retest, stocks rallied for a very long period of time. A similar period of long-term indecisiveness took place between 1996 and late 2016. As of this writing, the bullish breakout is still in place.
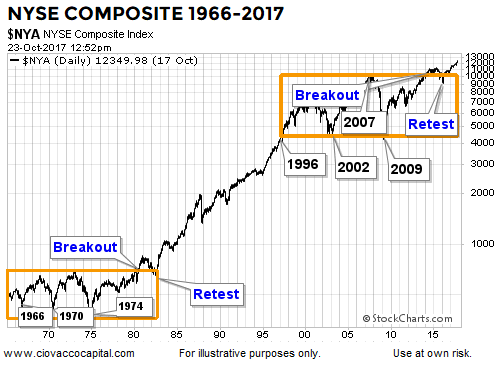
Market history tells us the longer a market goes sideways, the bigger the move we can expect to get once a bullish breakout or bearish breakdown occurs. In the present day, stocks moved inside the upper orange box for 21 years. Since first covering the mother of all breakouts on January 27, 2017, stocks have followed the bullish script.
Disclaimer: The opinions in this document are for informational and educational purposes only and should not be construed as a recommendation to buy or sell the stocks mentioned or to solicit ...
more

