
The Mid-Cap Equity Premium Is Still King
Mid-cap stocks are often called the “sweet spot” in the market-capitalization spectrum for equity investing. History agrees. Mid-cap performance has delivered a solid premium over large-caps and small-caps over the last two decades. This is a bit of conundrum for financial economics. The academy’s models, after all, insist that small caps are destined for stellar performance over the rest of the field. But the track record over the last 20 years has thrown out the script and awarded the gold to mid-caps.
The debate about why mid-caps win the performance race runs far and wide. Some analysts say it’s a matter of faulty benchmarks, particularly in the small-cap space. Others argue that the strong mid-cap returns are bound up with the small-cap premium by way of small companies that grow larger. There’s also plenty of disagreement about what exactly defines the borderline between small- and mid-cap stocks. Is it a $500 million market cap? $1 billion… $5 billion? Meantime, an interesting study by Cliff Asness and his colleagues at AQR Capital recently penned an intriguing explanation by advising that controlling for small-cap junk (companies that are suffering for one reason or another) revives the case for expecting a small-cap premium. (For a summary of the paper’s conclusions, see my review here.)
Whatever the explanation, there’s no denying that mid-caps have provided superior returns vs. small- and large-cap stocks, at least in terms of the standard indexes. Let’s dig into the details a bit by reviewing a set of popular benchmarks:
Russell Mid-Cap Price Index
Russell 1000 Price Index (large cap)
Russell 2000 Price (small cap)
A buy-and-hold investment strategy in all three benchmarks tells the story. A $1 investment in this trio on Dec. 31, 1995, would now (as of Sep. 14, 2016) be worth roughly $4.75 for the mid-cap portfolio—well above the $3.37 for small caps and $3.10 for large caps. As relative performance comparisons go, this test looks rather decisive in favor of mid-caps.

For another perspective, let’s review how mid-caps fared in relative terms vs. small- and large-caps via daily return spreads. The procedure: take the mid-cap’s daily return and subtract the equivalent for small- and large-caps and keep a running total of the results, as shown in the next chart below. To the extent that mid-caps outperform (underperform) the lines rise (fall).
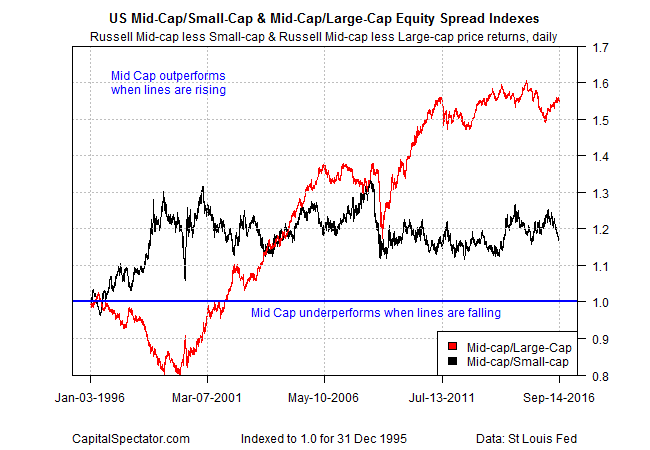
Mid-cap performance has been especially strong vs. large-caps over the last two decades, although there’s also clear if lesser edge over small-caps as well.
Note, however, that while the relative advantage over small-caps has been comparatively moderate and stable, the cumulative performance premium over large-caps has been on a tear in recent years. But the mid-cap premium vs. large-caps also shows considerably higher volatility vs. the mid-cap/small-cap spread. During the late-1990s and the first two years of this century, mid-caps underperformed large-caps by a sizable margin. The stumble was temporary, but the weakness serves as a reminder that mid-caps could fall short again.
But for the moment, the gravy train in the sweet spot for market cap rolls on. Explaining why is still a challenge, albeit only for researchers. The lack of models that can justify the mid-cap premium isn’t going to deter the crowd from chasing the stellar real-world results in this slice of the stock market.
Disclosure: None.


