
The Medium-Term Trend - Wednesday, Sept 13
New 52-week lows have dropped down to remarkably low levels. Very bullish for the general market.

The momentum indicator is still pointing bullishly higher although near to the top of the range.

The bullish percents finally moved today, and these indicators are now in sync with a market that just keeps moving up and up.

No surprise, the PMO is up against its maximum value. It is a powerful uptrend for this stock market.

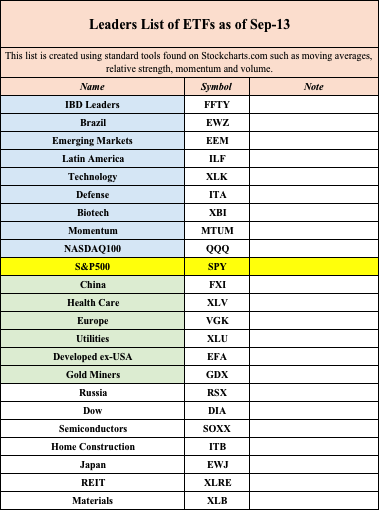
The Leader List
I have changed this spreadsheet. The long-term leaders are blue, the short-term leaders are green and the ETFs showing recent strength are shown at the bottom. The S&P500 is the benchmark.
The stock market strength has broadened out, so this list is getting very long.
MTUM might be breaking out of a base.

Energy is showing some strength. Strength in this area removes one the bearish themes for the general market.

The Emerging Market ETF is just under the 2007 peak. Will it break through? Very bullish if it does.

The ex-USA Developed Market ETF broke out a few months ago. I think this favors a break out for EEM as well.

Outlook
The ECRI index is pointing to weak economic growth in the months ahead.
The long-term outlook is worrisome.
The medium-term trend is up.
The short-term trend is up.
Disclaimer: I am not a registered investment advisor. My comments above reflect my view of the market, and what I am doing with my accounts. The analysis is not a recommendation to buy, ...
more

