
The Market’s Traffic Lights
I wanted to offer up a simple metaphor for where I think the market is by way of a traffic light. In each of the five charts below:
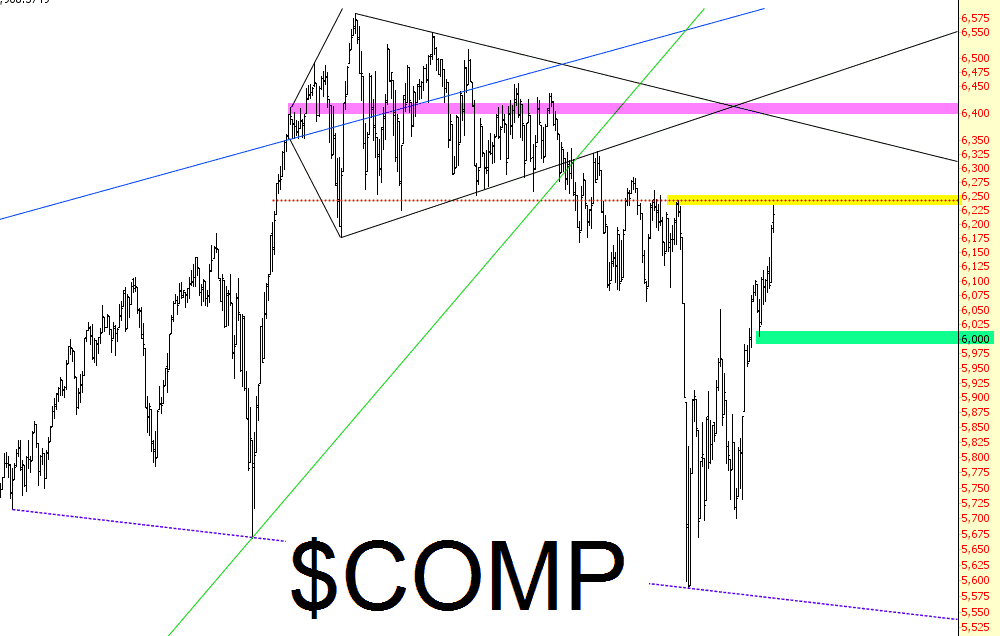
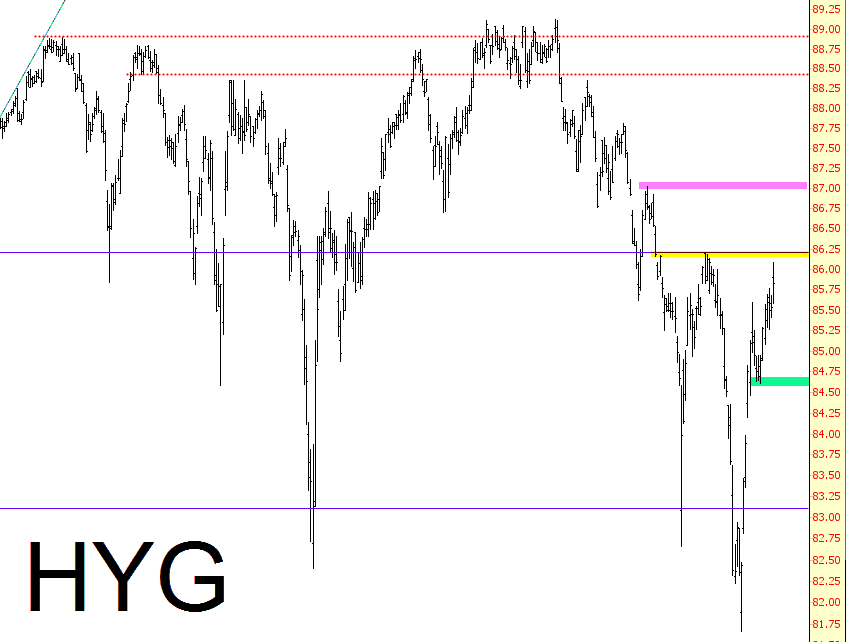
+ the green tint represents the level which, should the price drop beneath it, meaningful weakness in the market is affirmed;
+ the yellow tint represents the level which, should the price go above it, further weakens the bear case (which has already been weakened by staggering market strength);
+ the red (OK, magenta) tint represents the level which, should the price go above it, means the bears are pretty much screwed once more.
So here we have the Dow Jones Composite:
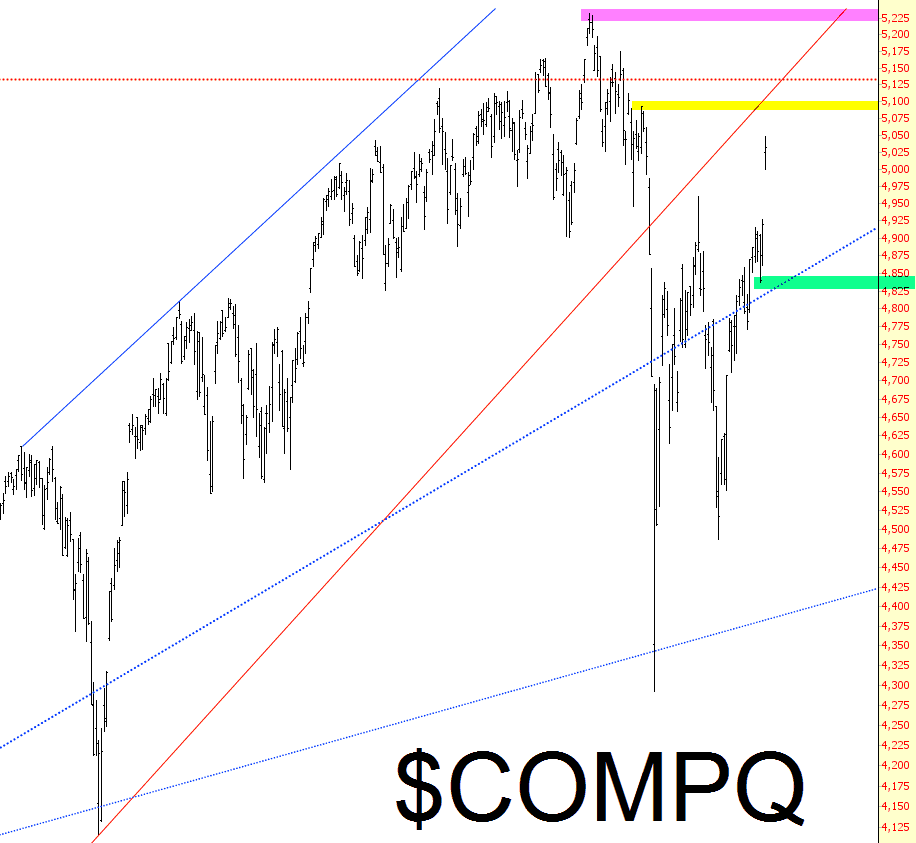
The NASDAQ Composite:
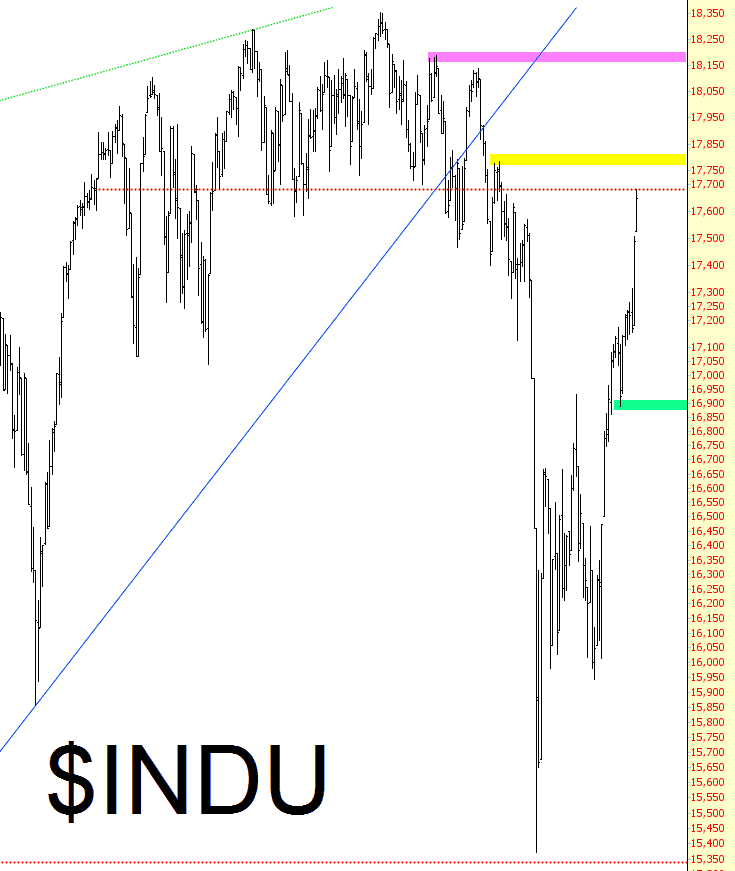
The Dow Industrials:
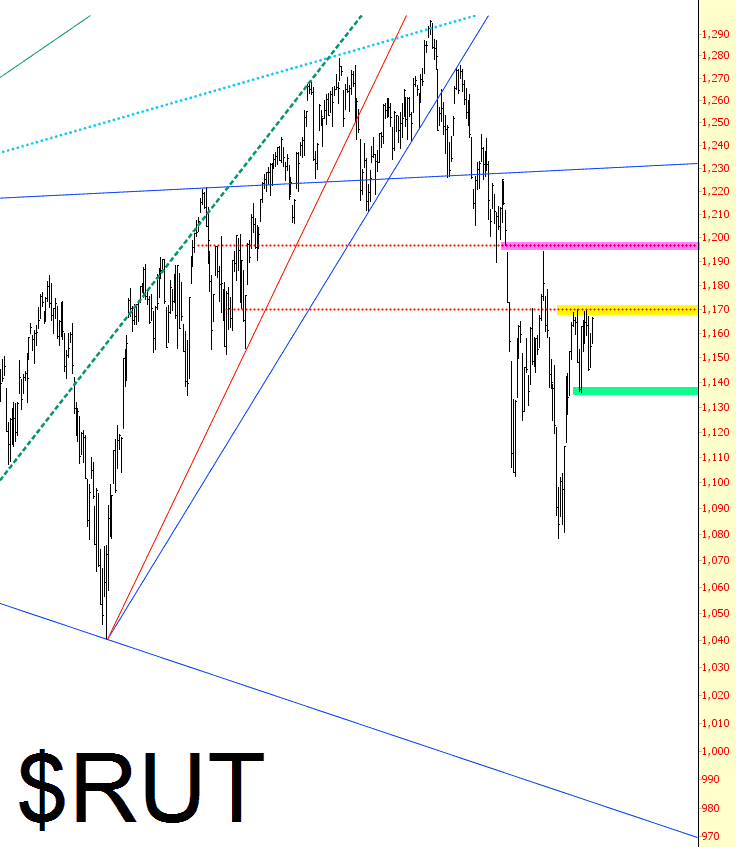
The Russell 2000:
And, a favorite of mine, the high yield index fund:
Not that the market cares what I think, but I sure wish the ascent in equity prices would…….

This blog is not, and has never been, investment advice. It is a place that allows me to express my own views on the market and specific securities – as well as make whatever cultural ...
more


Thanks again for your clear lines in the murky sand.